Does greater confidence mean the art market is doing better?
Separating market sentiment, current conditions and expectations
Think of confidence as a thermometer for sentiment: it describes what respondents believe, not a promise about the future. Compare auctions, the primary market, price segments and artists’ short- and long-term standing.
Original research · ArtTactic
Reading & commentary · Art Value Lab
 Art Market Confidence Survey — September 2026
- Overall confidence rose from 43 to 56, crossing the threshold of 50.
- Auction confidence was 78 and primary-market confidence 51; recovery differed by segment.
- Confidence and perceived risk can rise together; short-term optimism is not long-term artistic importance.
Figures refer to the source samples and survey period; expectations are not realised outcomes.
Why can experts feel optimistic today and more cautious about the next six months?
Sentiment is not a prediction
A survey can ask specialists how conditions feel now and what they expect next. The answers provide evidence about judgement rather than a guarantee of future sales.
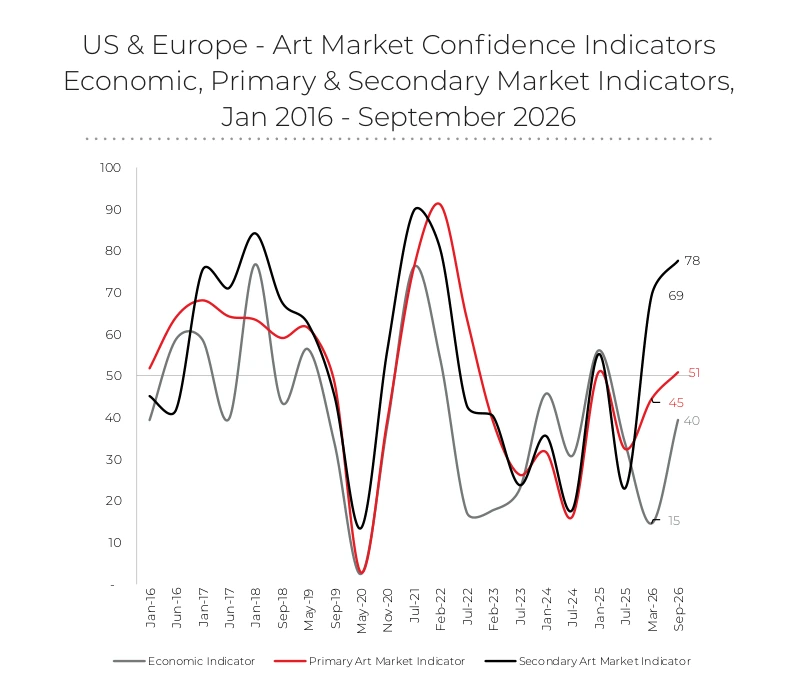
ArtTactic’s overall confidence indicator reached 56 in September 2026, versus 43 in March. Above 50 means positive sentiment outweighs negative sentiment; 56 does not mean that 56% of respondents expect prices to rise.
The report places improving sentiment alongside recovering auction activity. The two are different evidence types, and simultaneous increases do not establish causation.
Take with youFirst ask whether a number describes opinions or completed transactions.
Source report pages · 3–6Auctions and the primary market move differently
Auction confidence rose from 69 to 78, while primary-market confidence increased from 45 to 51. Both improved, but the strength of recovery differed. Auction sentiment cannot stand in for every gallery’s or artist’s operating conditions.
The economic indicator rose from 15 to 40 but remained below 50. Optimism about parts of the art market can coexist with concern about the wider economy.
These measures answer different questions. Combining them into an improvised average would hide those distinctions.
Stronger today, more cautious about tomorrow
The auction Current Indicator was 89, versus 66 for the next-six-month Expectations Indicator. Both were positive, yet future expectations were lower: respondents could recognise improvement without assuming it would continue at the same pace.
The market-direction distribution was 35% up, 60% flat and 5% down. A majority expecting stability describes consolidation rather than uniform enthusiasm for rapid growth.
The page 7 chart calls this a six-month outlook, while prose and highlights say twelve months. The supplied file does not resolve that mismatch, so the horizon should remain qualified.
Take with youConfidence in current conditions can coexist with expectations of stability.
Source report pages · 3–4、7Different price segments have different conditions
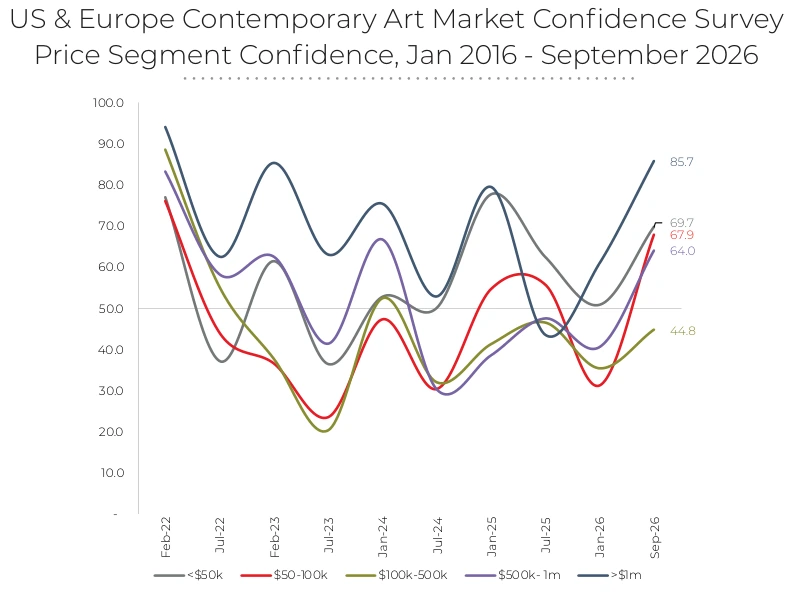
Confidence was approximately 86 above $1 million, 70 below $50,000 and 68 in the $50,000–$100,000 band. The $100,000–$500,000 segment was weaker at about 45, while $500,000–$1 million stood at 64.
These are sentiment readings, not shares of transactions or expected investment returns. Confidence at lower price points does not establish that every first-time buyer is increasing their budget.
The platform’s under-$50,000 report adds evidence about collecting behaviour, but its respondents, questions and timing differ. The figures cannot be directly combined into a growth estimate.
Optimism can coexist with greater perceived risk
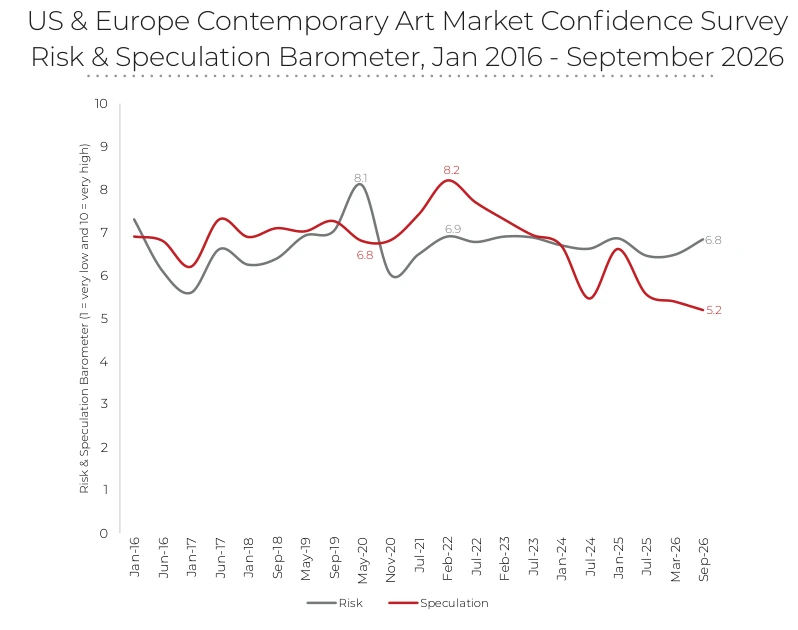
Perceived risk rose from 6.5 to 6.8, while speculation fell from 5.4 to 5.2, both on a 1–10 scale. The report associates caution with geopolitical and economic uncertainty and sees limited evidence of a renewed speculative boom.
Risk and speculation are distinct. Buyers can focus on established markets while worrying about external conditions, or remain interested in a transaction while limiting their exposure.
These readings neither describe every buyer’s psychology nor quantify the probability of a loss. They identify conditions worth investigating.
Six-month confidence and ten-year importance
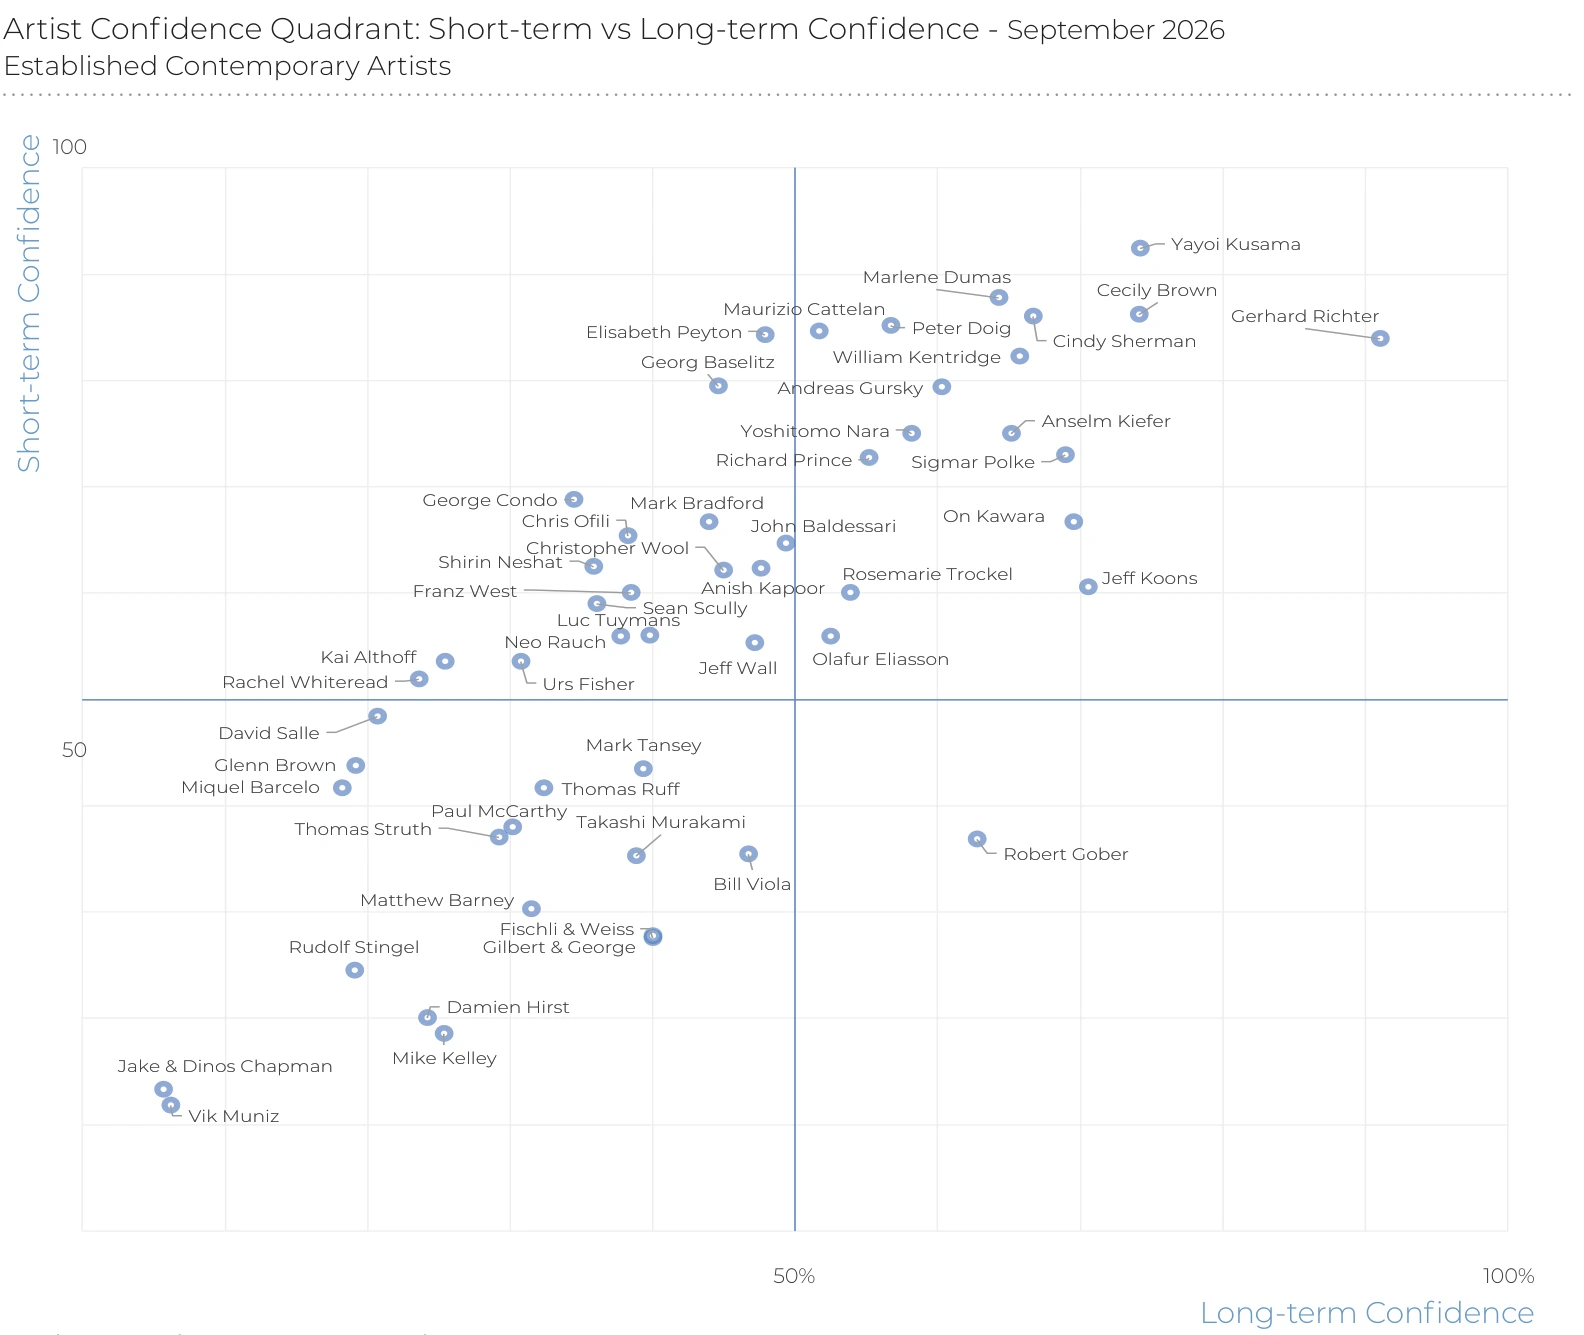
Short-term confidence asks about the coming six months; longevity asks about market importance in ten years. The first relates positive and negative answers, while the second is the share choosing high importance. Their scales differ.
Yayoi Kusama leads the short-term ranking, followed by Marlene Dumas and Cecily Brown. Gerhard Richter leads the long-term ranking, followed by Kusama and Brown. These are respondent judgements about markets, not rankings of aesthetic merit.
The two-axis quadrant shows why immediate attention and long-term conviction need not coincide. Long-term market standing is also different from art-historical, social or personal significance.
Read the two reports as different kinds of evidence
The guarantee report describes transactions in selected auctions; this survey records respondent sentiment. Together they invite questions about whether returning trophy consignments coincide with changing expectations, without proving a causal relationship.
Start with the sample and question, identify whether the number is a value, share or index, and note its time horizon. These steps prevent unlike measures from appearing comparable.
For a new reader, the goal is not to memorise who ranks first. It is to ask what a number explains and what remains unknown.
Take with youConfidence is a starting point for enquiry, not a shortcut to judging a work.
Source report pages · 3–12Methodology & source
Based on the supplied 15-page Art Market Confidence Survey — September 2026. Charts focus on the US and European Contemporary market and established Contemporary artists. The supplied file does not provide sufficient respondent counts, recruitment detail or weighting to establish representativeness. Confidence indicators describe the relationship between positive and negative answers; readings above 50 are not the percentage of optimistic respondents. Longevity is the share expecting high market importance in ten years. Page 7 labels its chart as six months, while prose and highlights describe twelve months; the 35%/60%/5% distribution is retained without treating the horizon as settled. Some historical values in the page 6 chart differ from prose; recent values used here agree across the narrative and highlights.
Art Market Confidence Survey — September 2026
ArtTactic