Who takes the risk before the bidding starts? Auction guarantees explained
Following trophy works and third-party capital behind auction results
A seller may have a minimum financial commitment before bidding begins. This report traces guarantees across sellers, auction houses and outside backers, asking what rising sales reveal about competition.
Original research · ArtTactic
Reading & commentary · Art Value Lab
 Impressionist, Modern, Post-War & Contemporary Art — Auction Guarantee Analysis, 2016 H1–2026 H1
- Guaranteed hammer value reached about $1.78 billion in H1 2026, up 93.5% year on year.
- Third-party guarantees accounted for 98.2% of guaranteed value, a funding share rather than a return.
- Works above $10 million drove growth; a guaranteed sale does not establish competitive bidding.
Figures refer to the source samples and survey period; expectations are not realised outcomes.
If someone commits to backing a work before the sale, what can its auction price tell us?
A commitment before the sale
Imagine a seller worried that a work will attract no bid. A guarantee provides an agreed financial commitment before the sale, potentially helping secure the consignment. An auction house or an outside party may carry the agreed exposure.
The report measures the auction performance of guaranteed works. Guaranteed sales value is their hammer total, not the amount of capital contractually committed and not profit earned by guarantors.
Take with youSeparate the guarantee commitment, the sale price and realised profit.
Source report pages · 2–4Rising value, falling market share
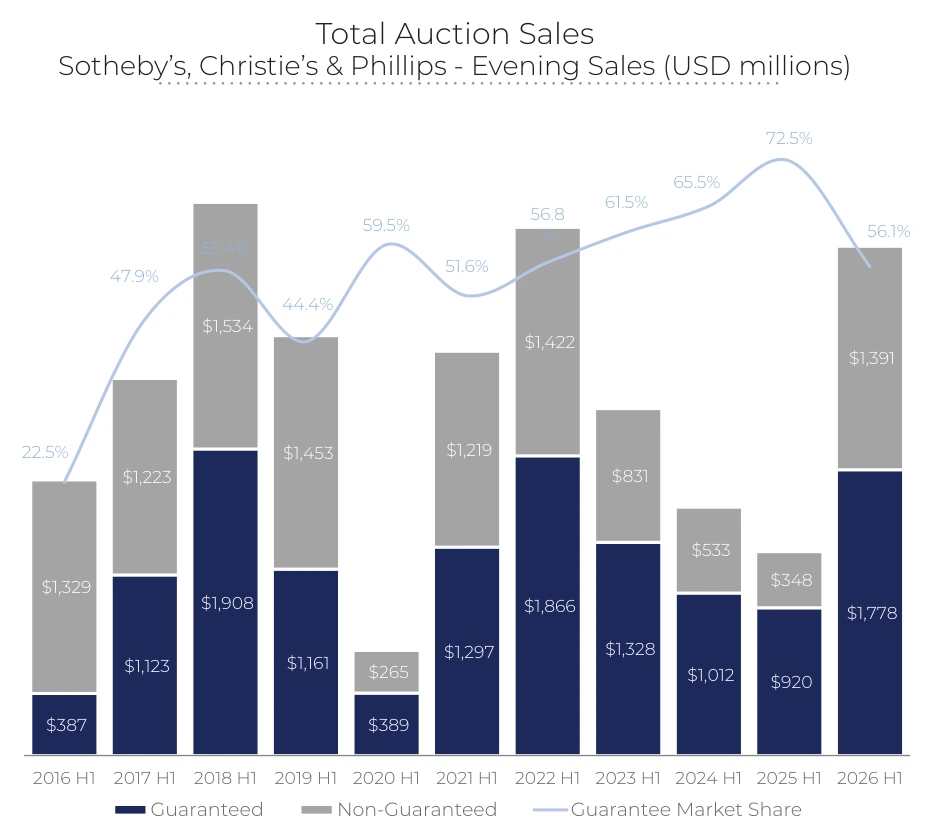
Guaranteed hammer value reached about $1.78 billion in H1 2026, up 93.5% from H1 2025. Yet its share of the sampled sales fell from 72.5% to 56.1%, as shown in the chart.
A larger numerator can have a smaller share when the denominator grows faster. Non-guaranteed value rose from about $348 million to $1.391 billion in the chart, suggesting the sample’s recovery extended beyond guaranteed works.
The page’s prose and chart disagree on guaranteed lot counts. This guide therefore focuses on value and avoids deriving a precise average from those counts.
Which works lifted the total?
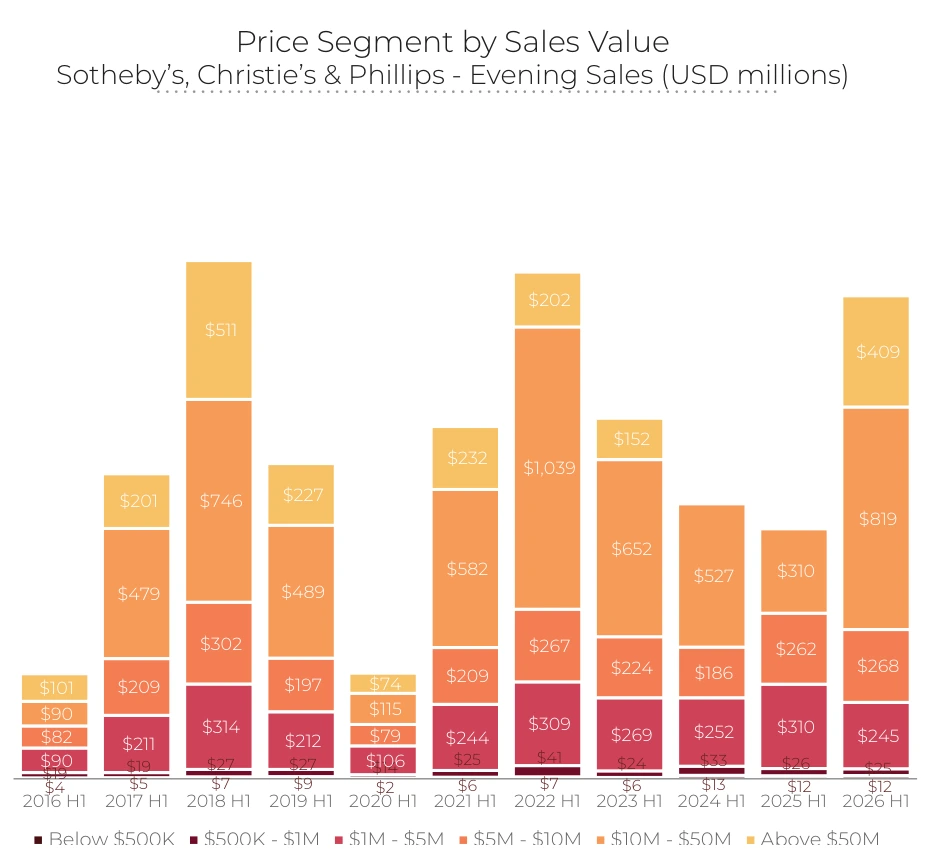
Guaranteed works above $10 million generated about $1.23 billion, compared with $310 million a year earlier. The report records 40 such works versus 16, including four above $50 million compared with none previously.
A few expensive consignments can materially change aggregate totals. The reported $157 million hammer price for Jackson Pollock’s Number 7A, 1948 illustrates that concentration.
The reported average guaranteed hammer price of about $6.66 million describes this sample. It is not a typical collecting budget or a price benchmark for art generally.
Take with youAsk how many high-value works account for a larger total.
Source report pages · 6、9、13Who is carrying the exposure?
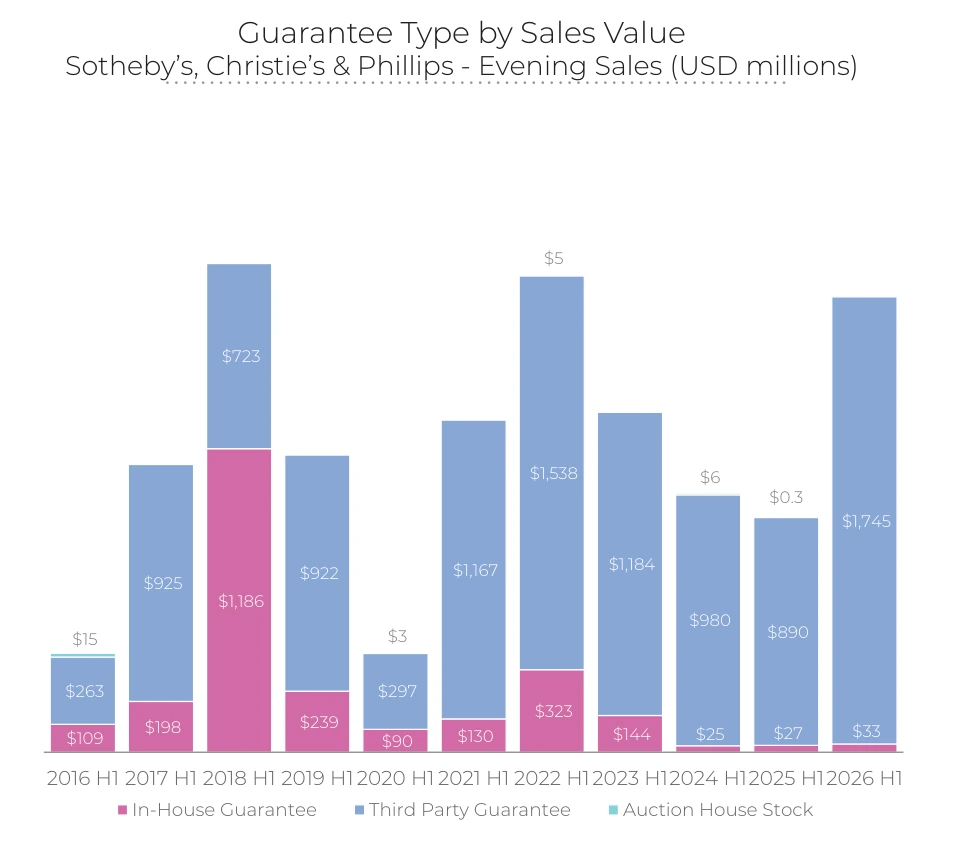
Third-party-backed works generated roughly $1.745 billion in hammer value, or 98.2% of all guaranteed value. In-house guarantees accounted for about $33 million.
Outside participation can transfer part of the auction house’s financial exposure. Risk remains: a guarantor may acquire the work and face holding, resale and contractual conditions.
The report gives estimated returns of 10.2% for third-party guarantees and −19.4% for in-house guarantees. The groups are not randomly assigned and private terms are incomplete, so the comparison does not establish that the mechanism itself causes higher net returns.
Concentration across cities and generations
New York generated about $1.55 billion in guaranteed hammer value, approximately 87% of the three-city sample. This concentration should not be treated as the experience of every art market.
Using the report’s generation categories, Impressionist guaranteed value rose from about $123 million to $395 million, and Modern from $405 million to $684 million.
More capital does not automatically mean stronger bidding. Some 74.4% of Impressionist guaranteed value sold at or below the low estimate, versus 24.1% for Modern works. Public prices may indicate limited competition but do not identify the buyer as the guarantor.
Take with youLarge totals, competitive bidding and broad demand require different evidence.
Source report pages · 6、12、14A few strong results do not establish a broad revival
The report asks whether results for Lucy Bull, Anna Weyant, Matthew Wong and Jadé Fadojutimi signal renewed demand for young Contemporary art. A strong estimated return on a single Lucy Bull work cannot describe an entire artist’s market.
The generation chart records only four guaranteed young Contemporary lots. Small samples are sensitive to individual results, and page 7 gives inconsistent return figures in prose and chart, so this guide does not use that value to establish a revival.
Persistence requires evidence from further sales, different works and non-guaranteed transactions, alongside exhibition, collecting and research support.
Source report pages · 7、10、14、18Putting the report to work
For an auction result, record guarantee status, the identified guarantor type, public estimates, hammer price and the lot’s contribution to the total. Leave confidential terms unknown rather than filling gaps with assumptions.
When reading the market-confidence survey alongside this report, separate completed transactions from expectations. They can provide context for each other without becoming interchangeable measures.
For art education, the central question is how many people and arrangements participate before a price is announced. Market value involves more than the final bid.
Source report pages · 2–14Methodology & source
Based on the supplied 19-page PDF, published in September 2026. Page references follow printed pages. The sample covers marquee H1 evening sales at Christie’s, Sotheby’s and Phillips in London, New York and Hong Kong from 2016 to 2026, involving over 2,330 guaranteed lots and over 574 artists. Values are hammer prices excluding buyer’s premium, converted at sale-date exchange rates. They describe sales of guaranteed works, not contractual guarantee commitments. Prose and charts differ for lot counts on page 5, some returns on page 7, London value on page 12 and Post-War value on page 14; disputed figures are not used as core comparisons. Estimated returns are not verified net profits and do not fully reveal private contractual costs. Artist generations follow the report’s categories.
Impressionist, Modern, Post-War & Contemporary Art — Auction Guarantee Analysis, 2016 H1–2026 H1
ArtTactic