Reading the U.S. art market: recovery, samples and collecting decisions
From Drew Watson’s interview to evidence, costs and decisions
Sales value and sold volume can move in different directions. Read methods, major collections, women artists and macro views before comparing sale proposals and preparing a handover.
Original research · Bank of America × ArtTactic · 2026
Reading & commentary · Art Value Lab
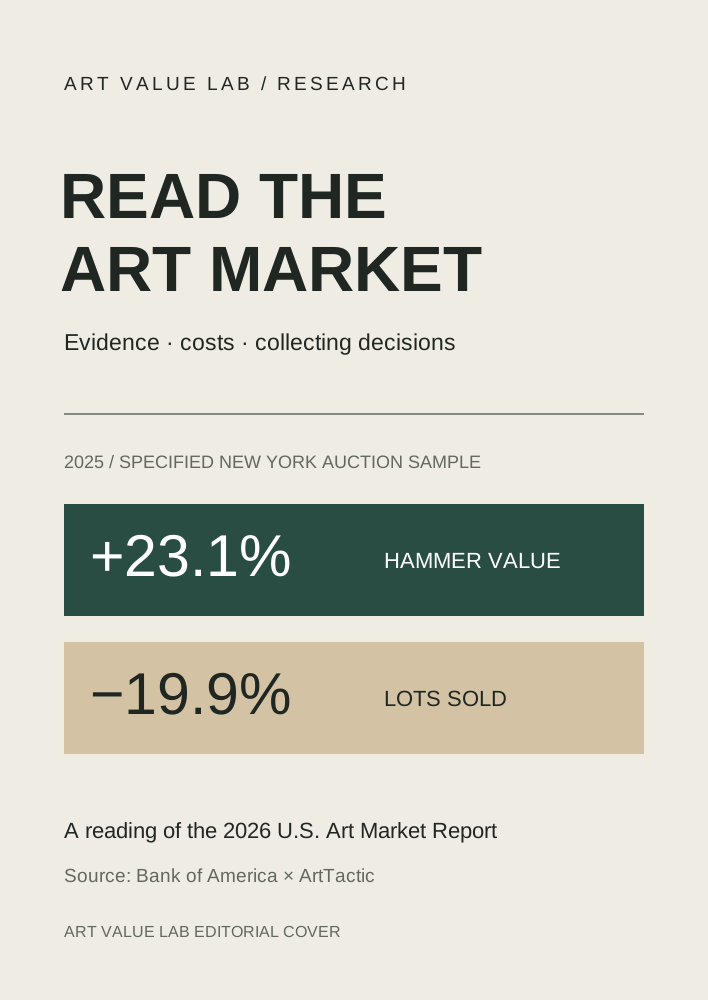 2026 U.S. Art Market ReportArt Value Lab editorial cover
- Value recovered while sold volume declined in the specified New York auction sample.
- Auction records, bank payments and economic views have different scopes.
- Collecting decisions also involve costs, timing, purpose and care responsibilities.
Figures refer to the source samples and survey period; expectations are not realised outcomes.
When I read “market growth,” do I know what and whom it counts, and which costs it excludes?
Three datasets, three questions
The 2026 U.S. Art Market Report combines auction evidence, art-related bank payment data and economic commentary. These sources can inform one another, but record different things.
Its main auction analysis covers specified fine-art categories at Christie’s, Sotheby’s and Phillips in New York from 2015 to 2025. Payments track particular customers and counterparties: one payment need not mean one artwork or one completed sale.
Public auction results offer traceable records, while private trade has different visibility. Ask whom each dataset observes and excludes before expanding a conclusion.
Source report pages · 5、42–43Value can rise while breadth narrows
In the specified New York sample, 2025 hammer value reached approximately $3.17 billion, up 23.1%, while 7,647 lots sold, down 19.9%. One measure counts money; the other counts works.
A small number of high-value works can move the total substantially. Price tiers, day and evening sales, artist coverage and unsold works help reveal the breadth of a recovery.
Annual results can also hide different directions across half-years. A sample-level comparison cannot establish the situation of every gallery or creator.
Source report pages · 16–18Read the base year and the supply of collections
In the interview, Drew Watson identifies the lower 2024 comparison base and major single-owner and estate collections as contributors to the rebound. Growth rates need their starting point.
Lauder, Pritzker and Robert and Patricia Ross Weis sales brought long-held works, provenance and collecting histories to market. Such episodic supply does not establish what will recur next year.
Watson also discusses stronger historical categories and women artists. Compare those category observations with the contribution of major collections rather than reducing his account to one cause.
Source report pages · 12–13、16、30–31Hammer value, acquisition spending and net proceeds
The report principally uses hammer prices excluding buyer premiums. Prices including fees, asking prices, formal appraisals and seller receipts answer different questions.
Teaching example: hammer 100 plus buyer premium 25 gives acquisition spending of 125. A later hammer sale at 160 with a hypothetical 10% seller commission leaves 144 before other costs.
Care may involve storage, shipping, insurance, restoration, equipment, software or interest. Compare proposals with their costs and payment timing made explicit. All rates in this example are hypothetical.
Source report pages · 20–21、42Rediscovery, scholarship and institutions
Watson connects some market changes for women artists with scholarship, museums addressing collection gaps and collectors rediscovering historical figures. This is his explanation, open to further investigation.
Sales growth, value share and annualised price changes in repeat-sale works are separate measures. A strong subgroup or successful resale sample cannot stand for every artist or holder.
Trace publications, exhibitions, acquisitions and transaction records for an artist. Which works become visible, what support reaches the artist or estate, and how concentrated is attention?
Source report pages · 23、28–29Locations and shares need their units
New York’s 69% share compares global hammer value across the specified three-house and category sample. Retain that scope and distinguish auction location, payer residence and artwork locations.
Some regional bank indicators count outbound payments. Shares of payment counts, spending value and artworks have different denominators and cannot be substituted.
A declining relative share may reflect faster growth elsewhere. Absolute change requires annual totals, not percentages alone.
Source report pages · 15、33–34、42Interest rates and wealth effects as questions
The interview discusses equities, rates, wealth effects and confidence. A wealth effect describes how changing asset values may affect perceived spending capacity; opportunity cost concerns the alternative uses of capital.
Supply, holders’ needs, economic conditions and participant groups also matter. Watson’s macro observations invite investigation; one rate change cannot predict one work’s price.
The outlook belongs to the first quarter of 2026, while the main auction statistics end in 2025. Separate observed transactions, expectations and later outcomes to be tracked.
Source report pages · 5、38–43From market reading to artwork handover
A market report opens a view of transactions. A collection also needs care, rights records, responsibilities and succession. This section is an Art Value Lab teaching extension informed by the Drew Watson profile research.
Before comparing sale proposals, state the purpose of the collection, timing needs and works to retain. Check fees, payment, publicity and unsold arrangements; gather missing records before deciding.
In ArtX Vault, connect funding, replacement authority, the next custodian and continuity arrangements with versions and rights. Let the recipient take part in a startup or recovery test.
Source report pages · 42–43;Art Value Lab 延伸Methodology & source
An Art Value Lab thematic guide based on the 2026 U.S. Art Market Report, the supplied Drew Watson interview and profile research. The main auction data cover specified categories at Christie’s, Sotheby’s and Phillips in New York, 2015–2025, principally at hammer value. Payments and economic commentary have separate scopes. Artist-period cohorts use birth years, not work dates or exact art-historical movements. Page references use printed source pages. Tools and handover worksheets are our editorial applications.
Read the original market report ↗
ArtTactic · Report overview ↗
2026 U.S. Art Market Report
Bank of America × ArtTactic · 2026
A short glossary
ART VALUE LAB · COLLECTING
From reading to the next collecting decision.
The interview and profile provide context. These readings, exercises and worksheets are Art Value Lab editorial applications.