Artnet Year Ahead 2026: who participates in the auction recovery?
Reading 2025 results, private auctions and three industry interviews together
Annual auction growth does not mean every artist, region or price band recovered. This report combines data with changing sales channels: major works attract competition while some transactions move behind closed doors.
Original research · Artnet Intelligence Report · March 2026
Reading & commentary · Art Value Lab
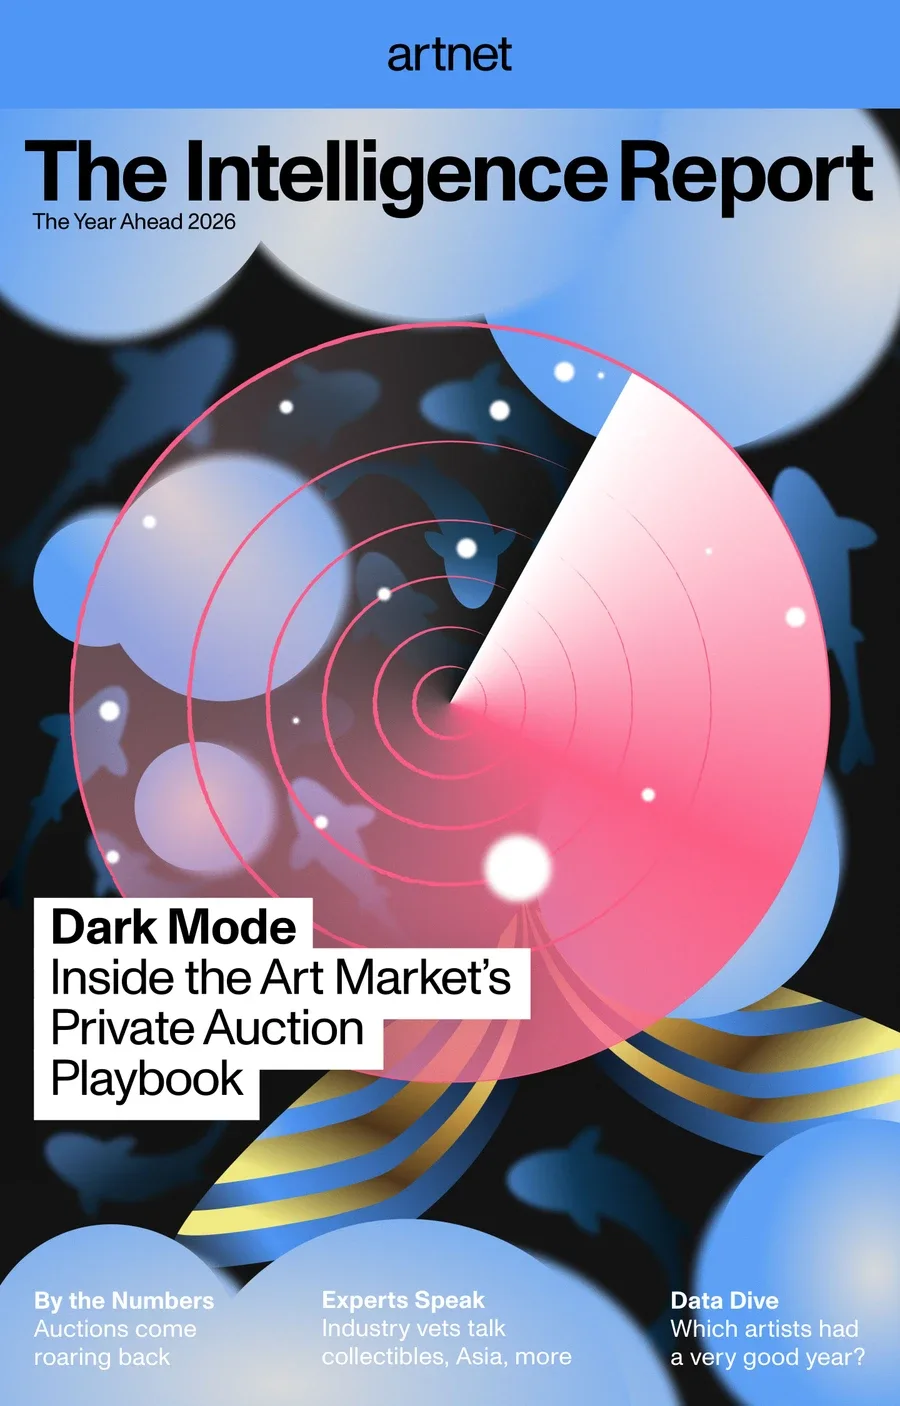 The Intelligence Report: The Year Ahead 2026
- Fine-art auctions reached $11.7 billion, up 13.3% but below 2021.
- High-value works and major collections drove an uneven recovery.
- Private auctions and collectibles complicate the boundaries of market measurement.
Figures refer to the source samples and survey period; expectations are not realised outcomes.
If masterpieces lift totals while other works remain under pressure, what kind of recovery is taking place?
The recovery arrived late in the year
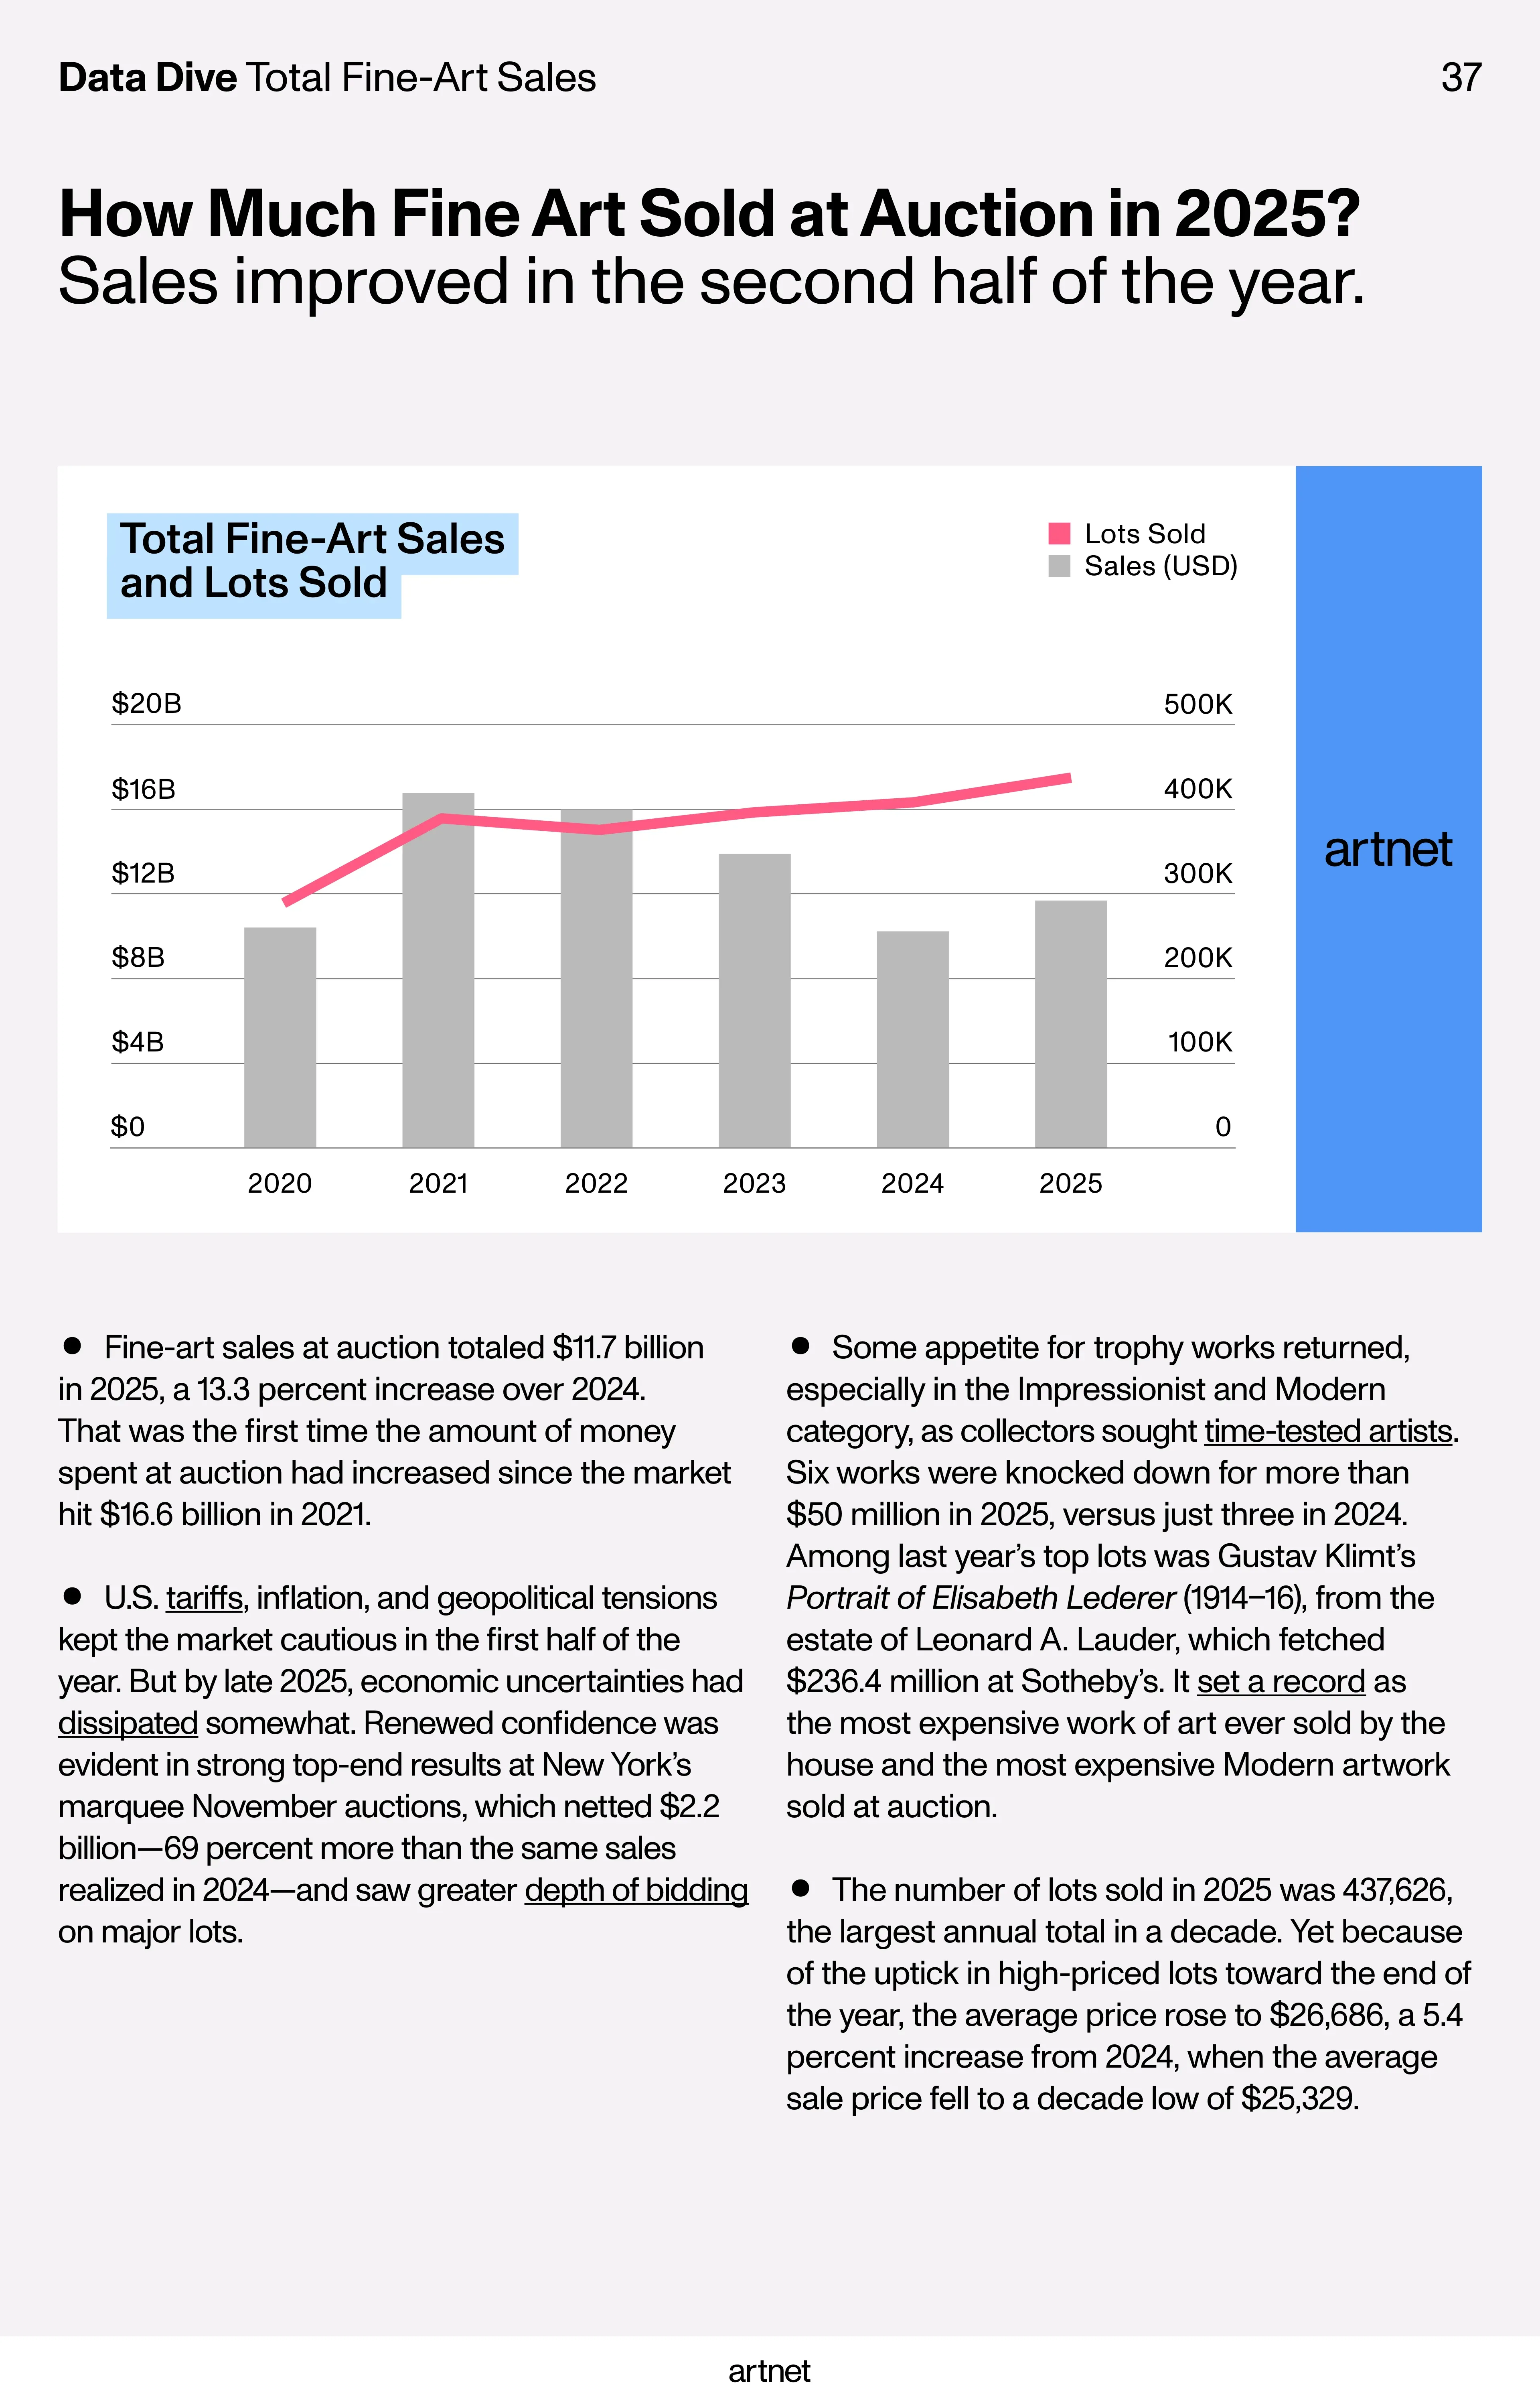
Fine-art auctions reached $11.7 billion, up 13.3% but below the $16.6 billion 2021 peak. Lots sold rose 7.5% to 437,626 and average price rose 5.4% to $26,686.
Much of the improvement arrived late: New York’s November marquee sales generated about $2.2 billion, 69% above comparable 2024 sales. Major consignments changed both annual averages and sentiment.
Geography remains uneven
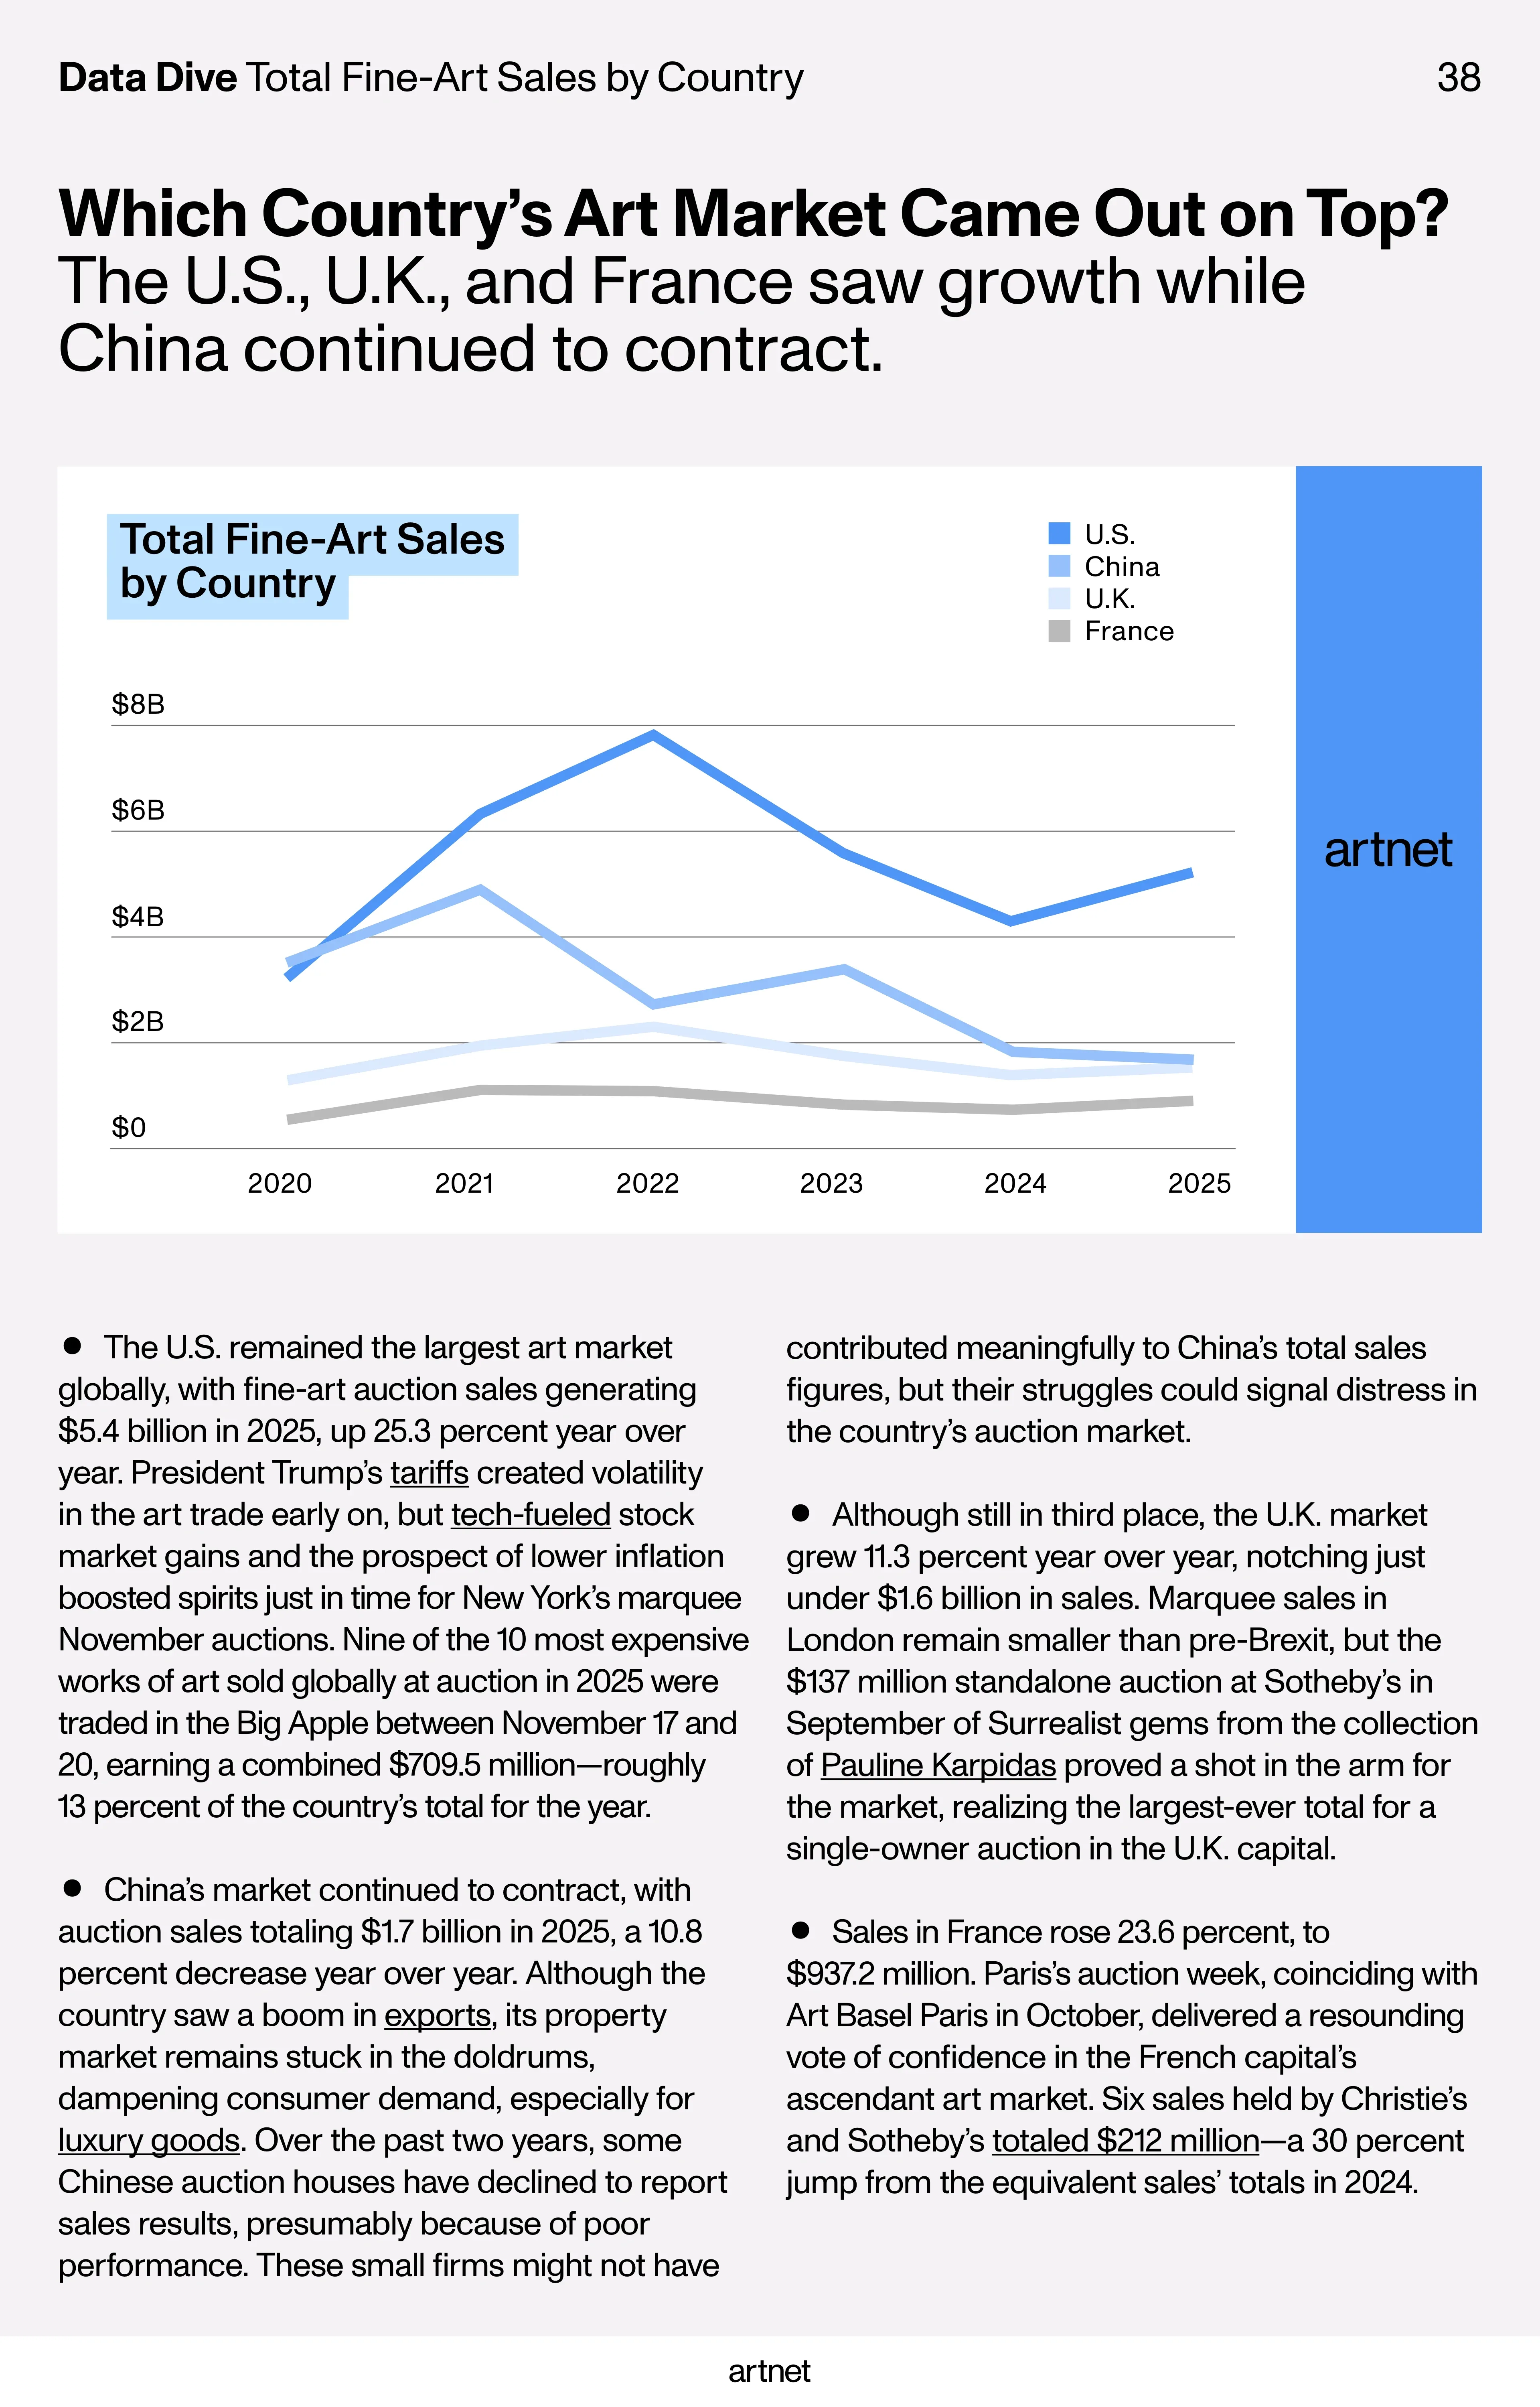
The U.S. reached about $5.4 billion, the U.K. just under $1.6 billion and France $937.2 million, all growing. China, including Hong Kong, fell 10.8% to about $1.7 billion.
These are sale locations rather than buyer nationalities. Non-reporting by some Chinese houses also highlights potential coverage gaps. Geography reflects consignments and data availability as well as demand.
Auction turnover is not profit
Christie’s generated about $3.5 billion in fine-art auctions, Sotheby’s $3.3 billion and Phillips $390.9 million. The first two grew while Phillips declined 14.2%.
These figures exclude private sales and are not the auctioneer’s retained revenue or profit. Commissions, consignment terms, guarantees and operating costs determine business economics.
Source report pages · 39Price bands and generations
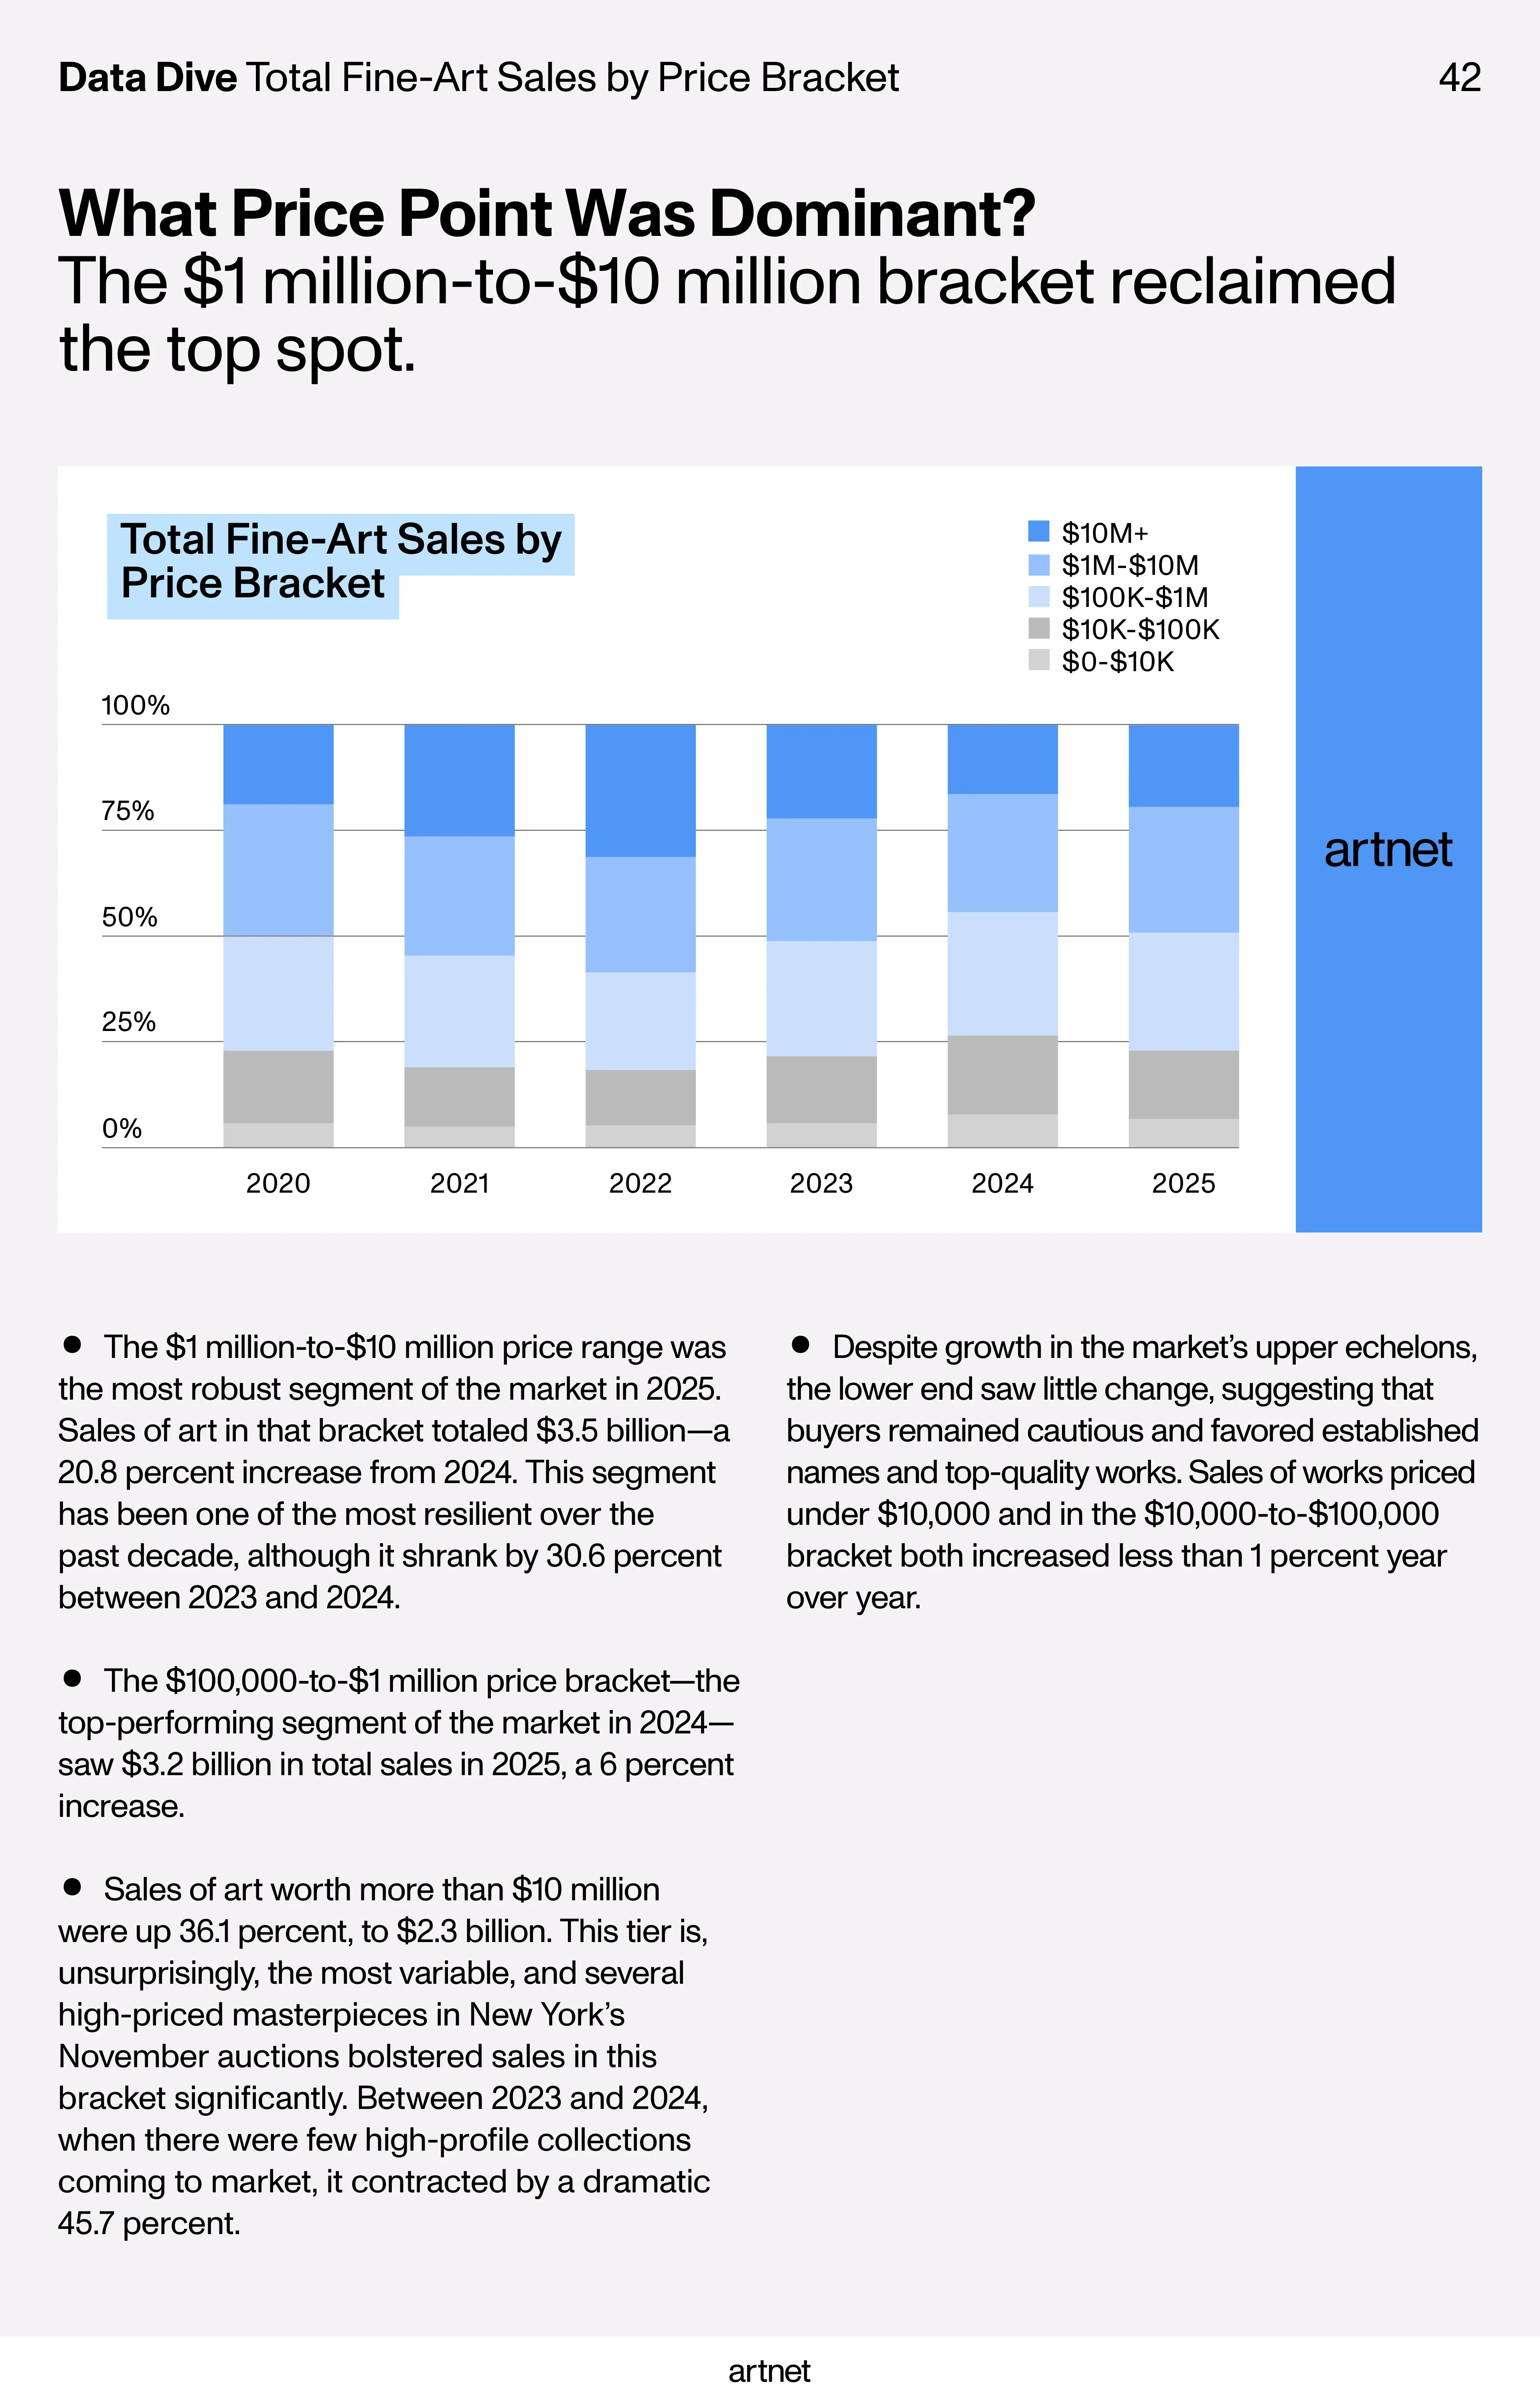
The $1–10 million band generated $3.5 billion, up 20.8%; works above $10 million produced $2.3 billion, up 36.1%. Both bands below $100,000 grew less than 1%.
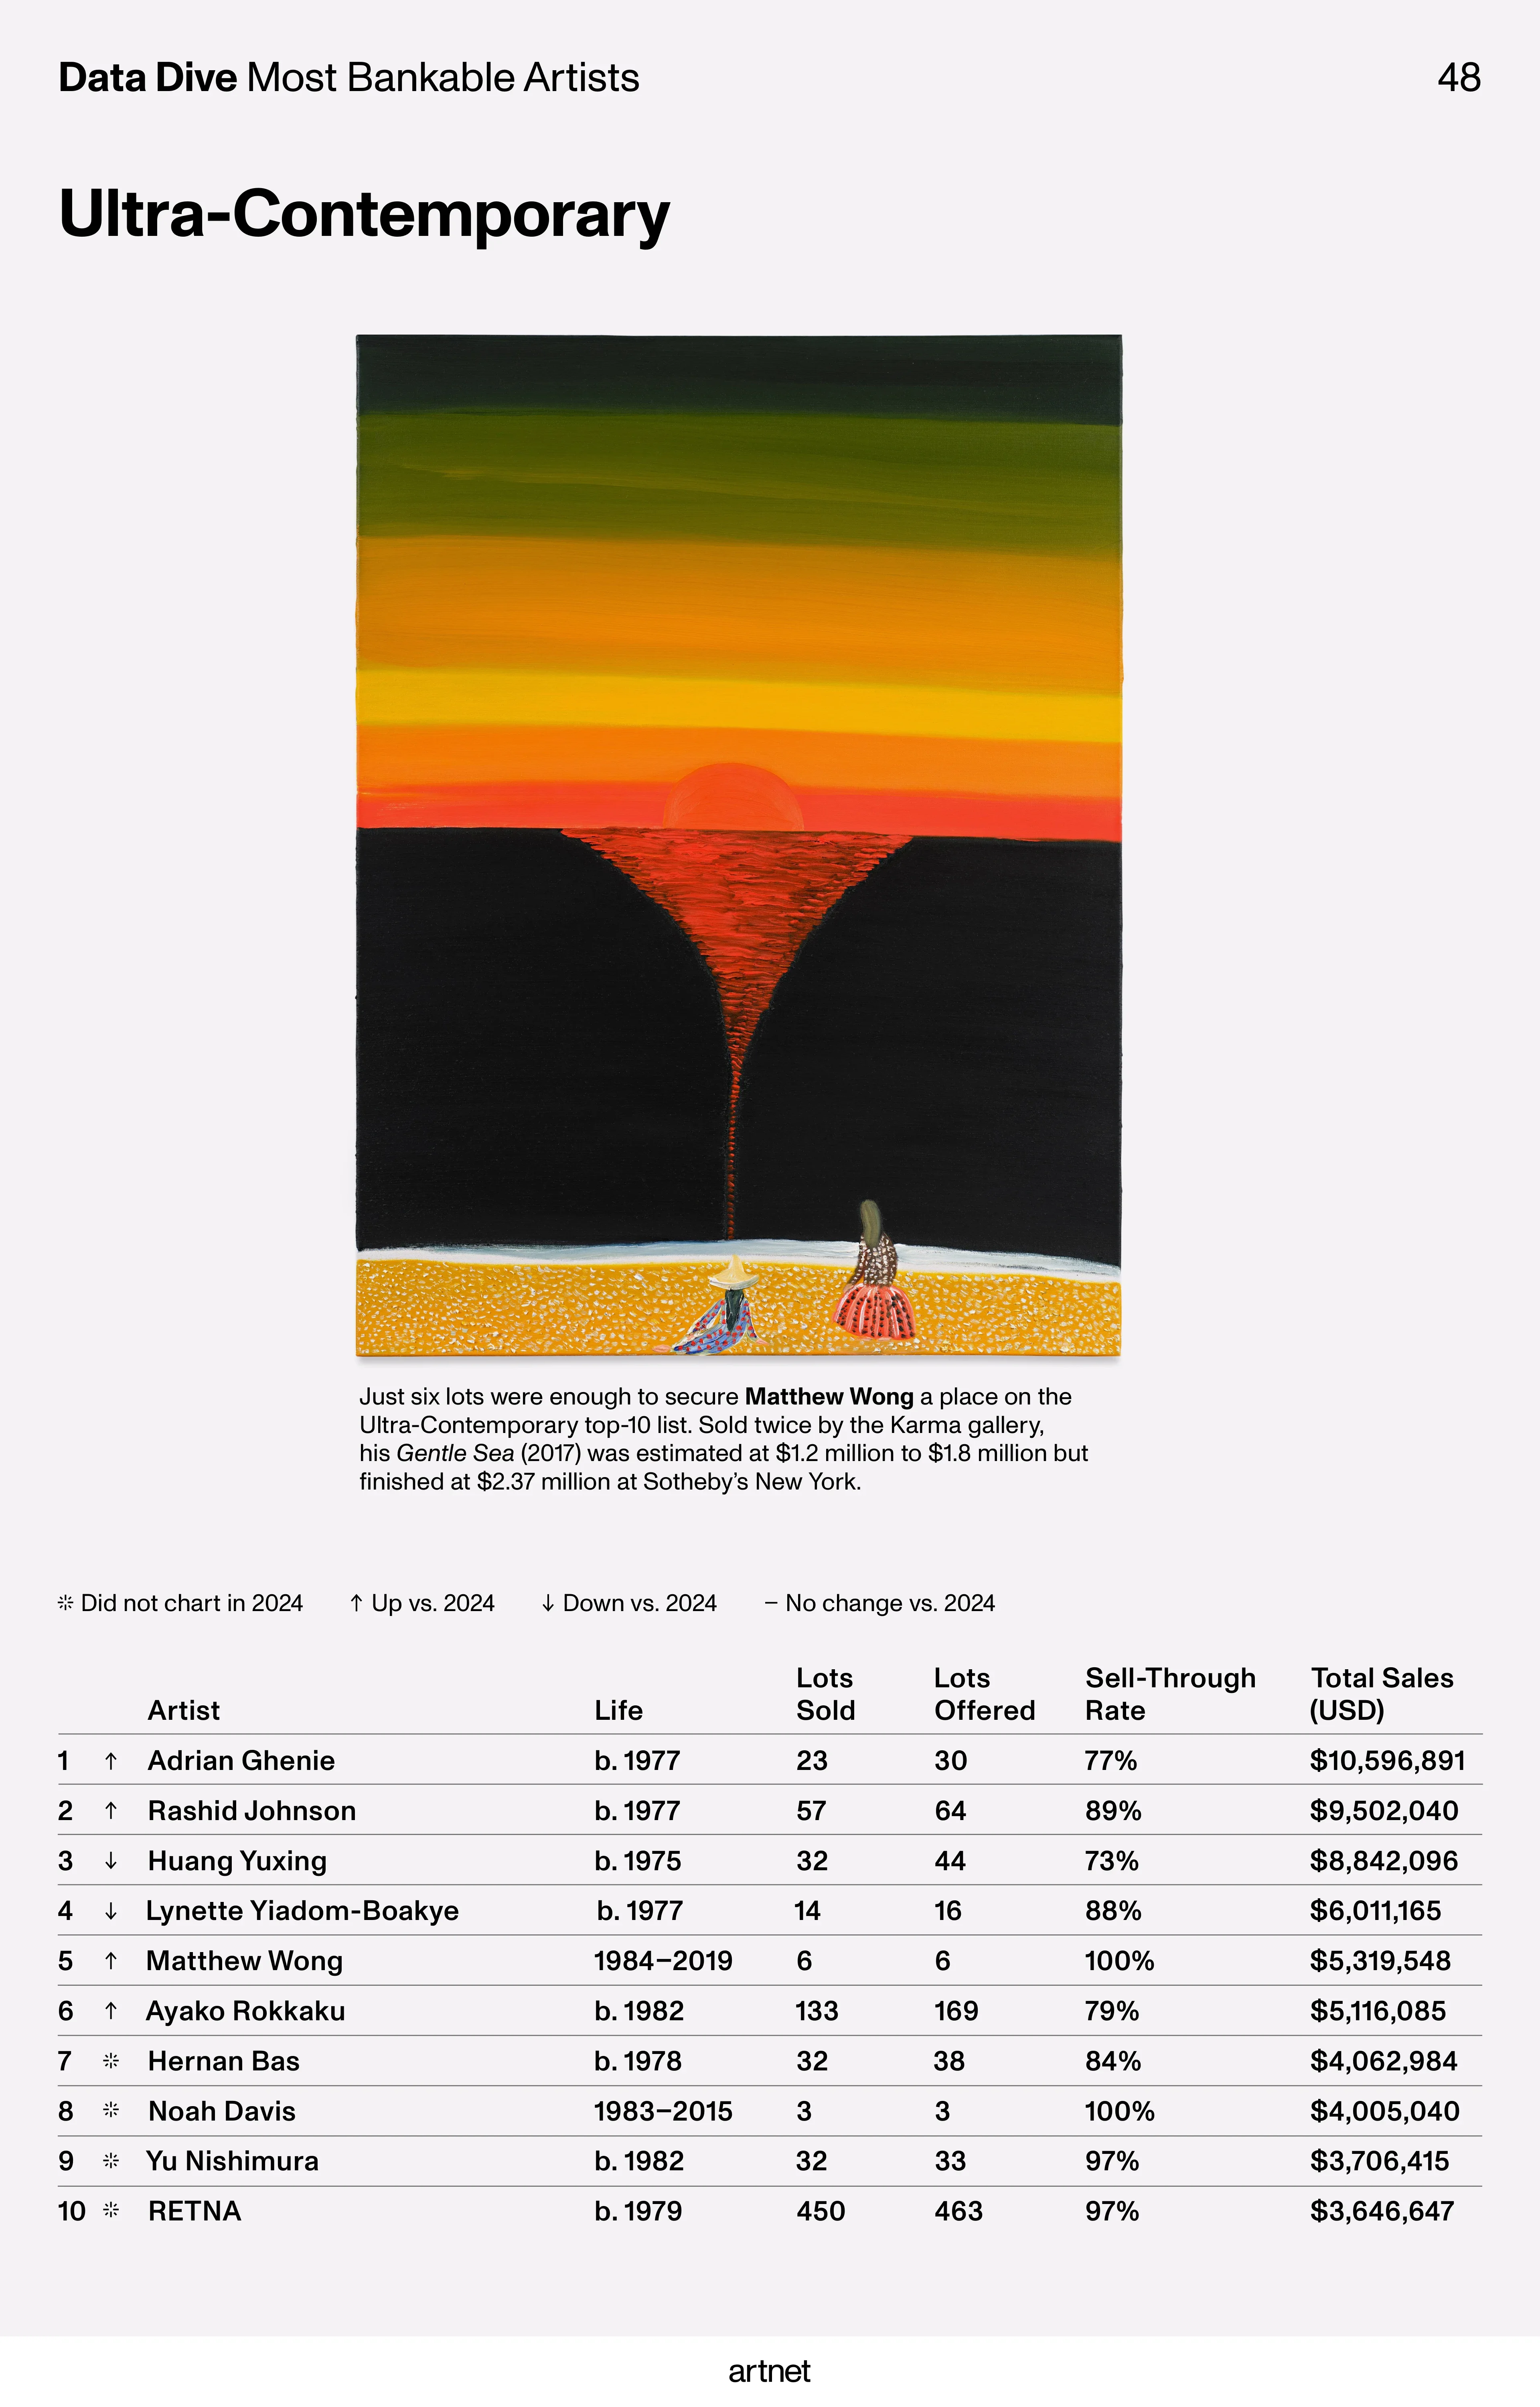
Impressionist/Modern art generated $4.7 billion, ahead of postwar/contemporary at $4.1 billion. Ultra-contemporary sales fell 26.5% to $229.9 million. Birth-year definitions and geographic exclusions matter when comparing these groups.
Online entry, searches and rankings
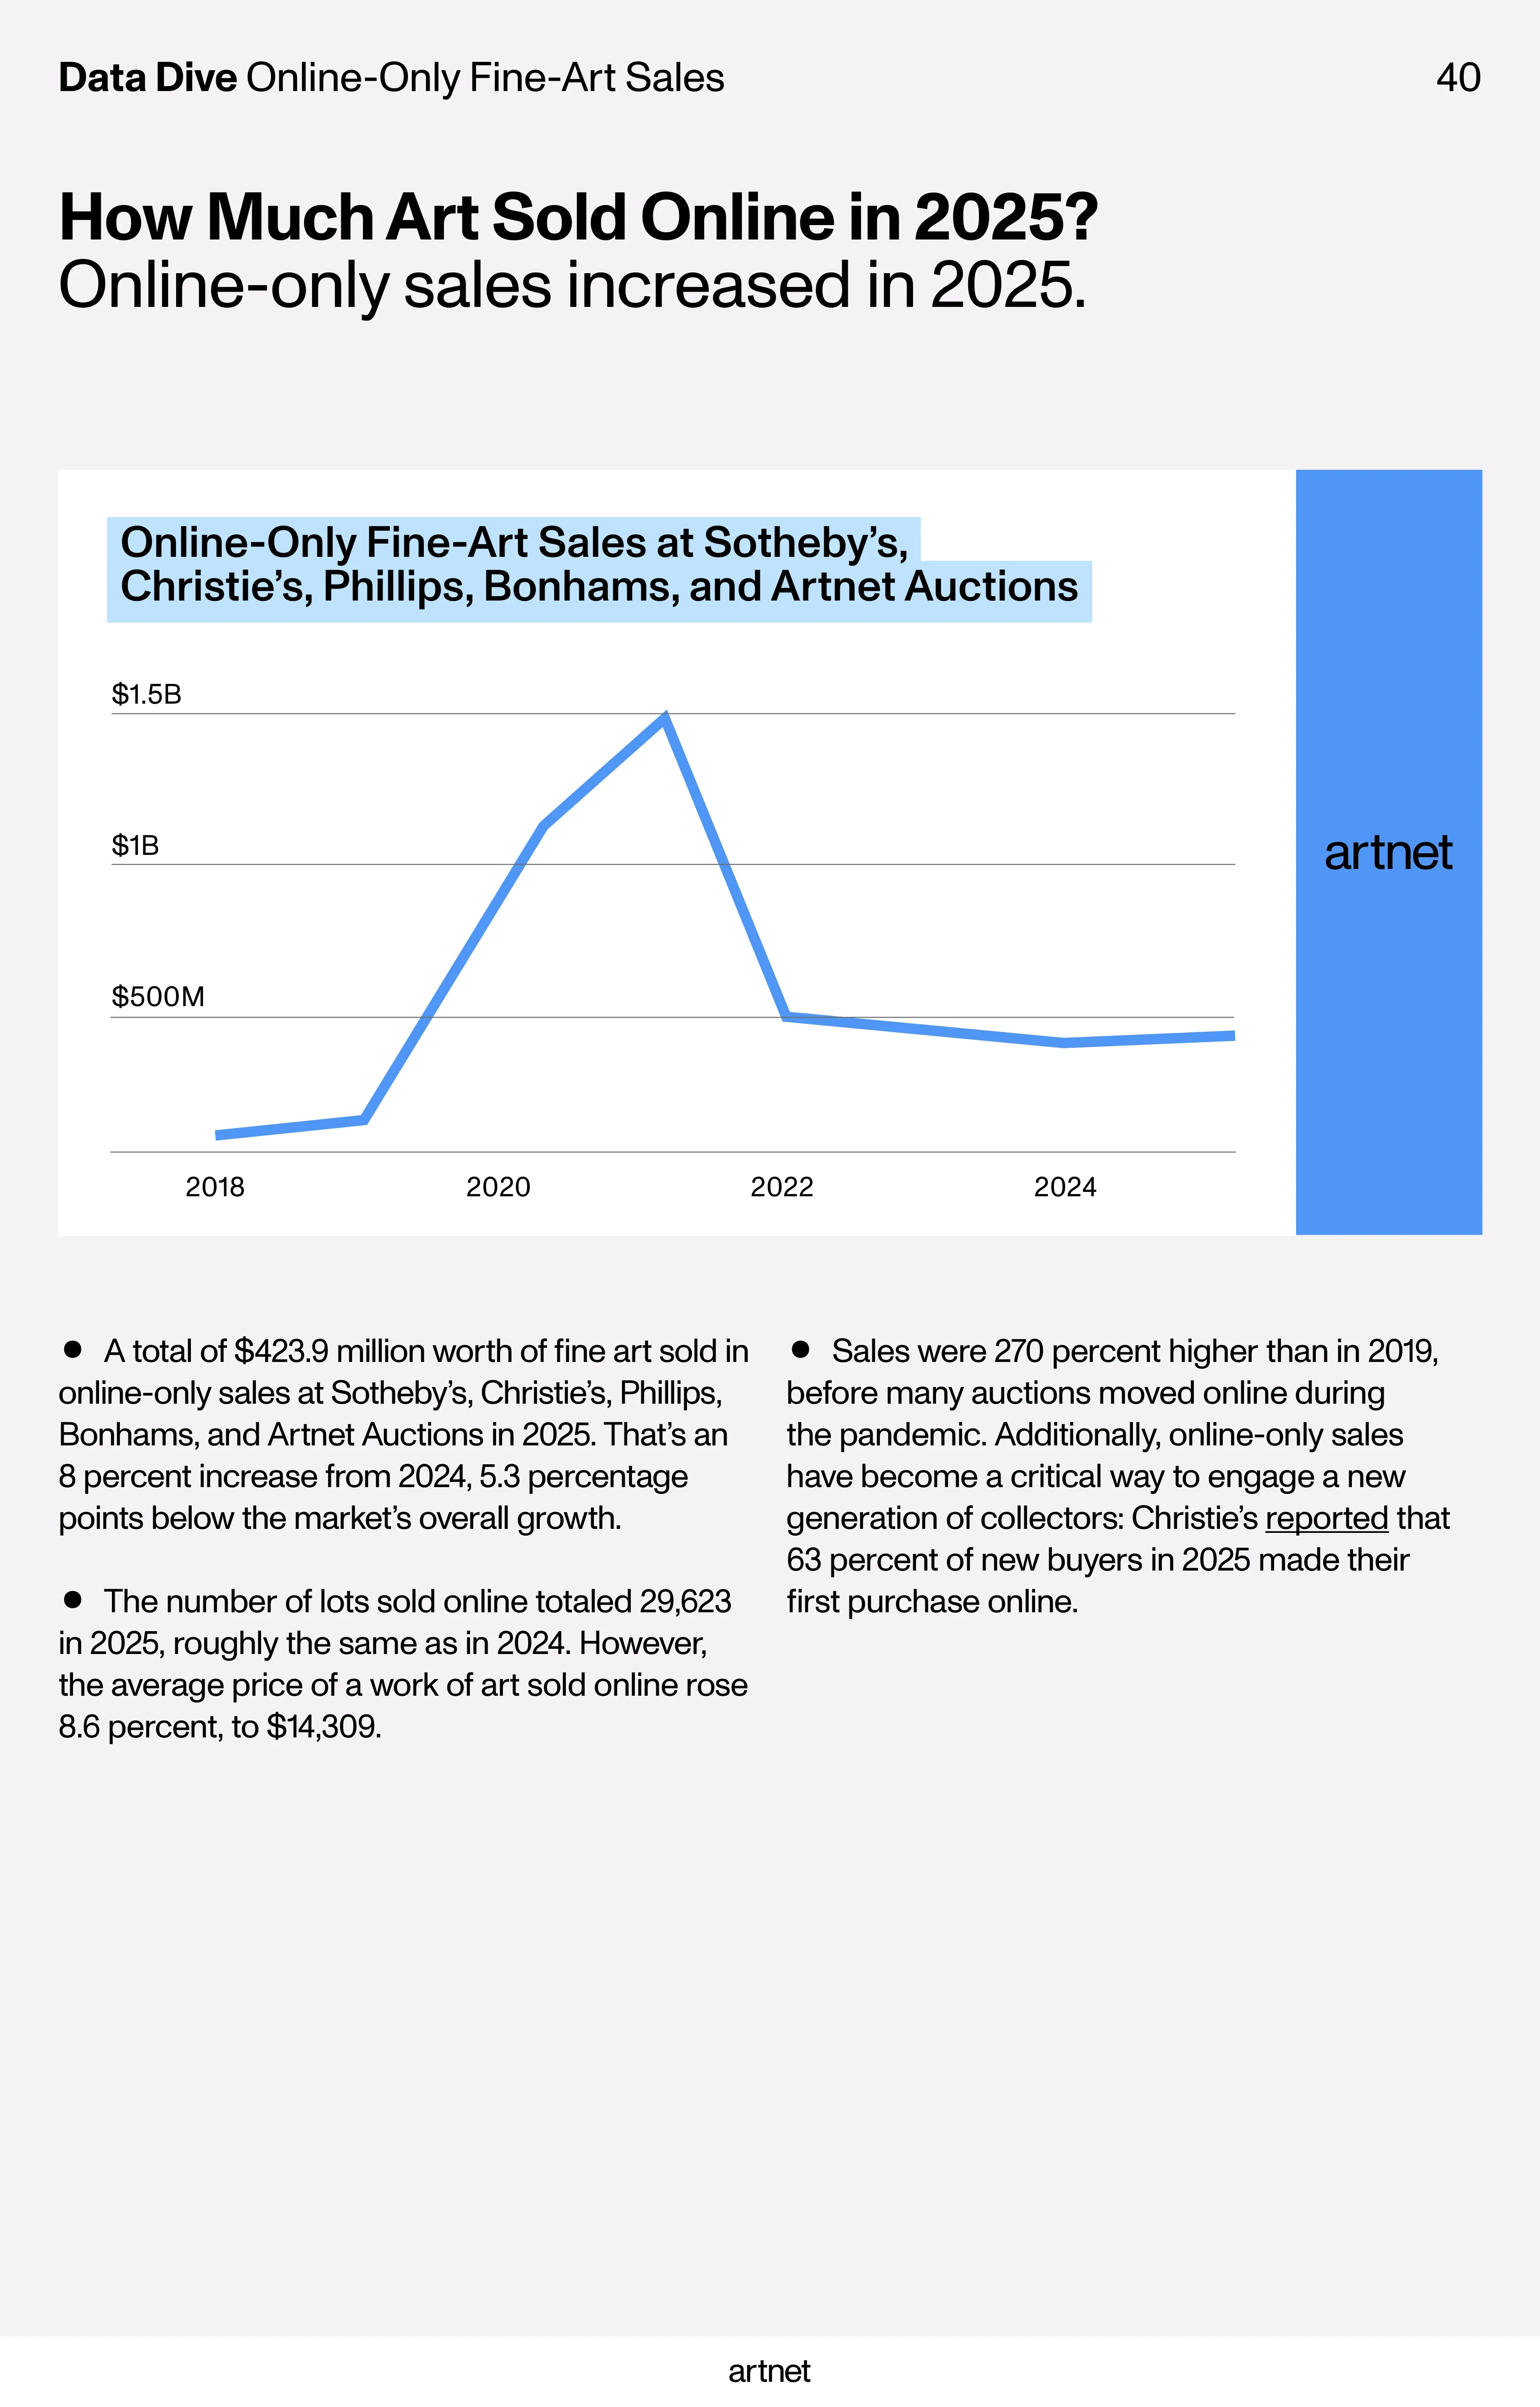
Online-only sales at five platforms reached $423.9 million, up 8% with broadly stable lot volume. Christie’s first-purchase statistic describes its own new buyers, not industry-wide retention.
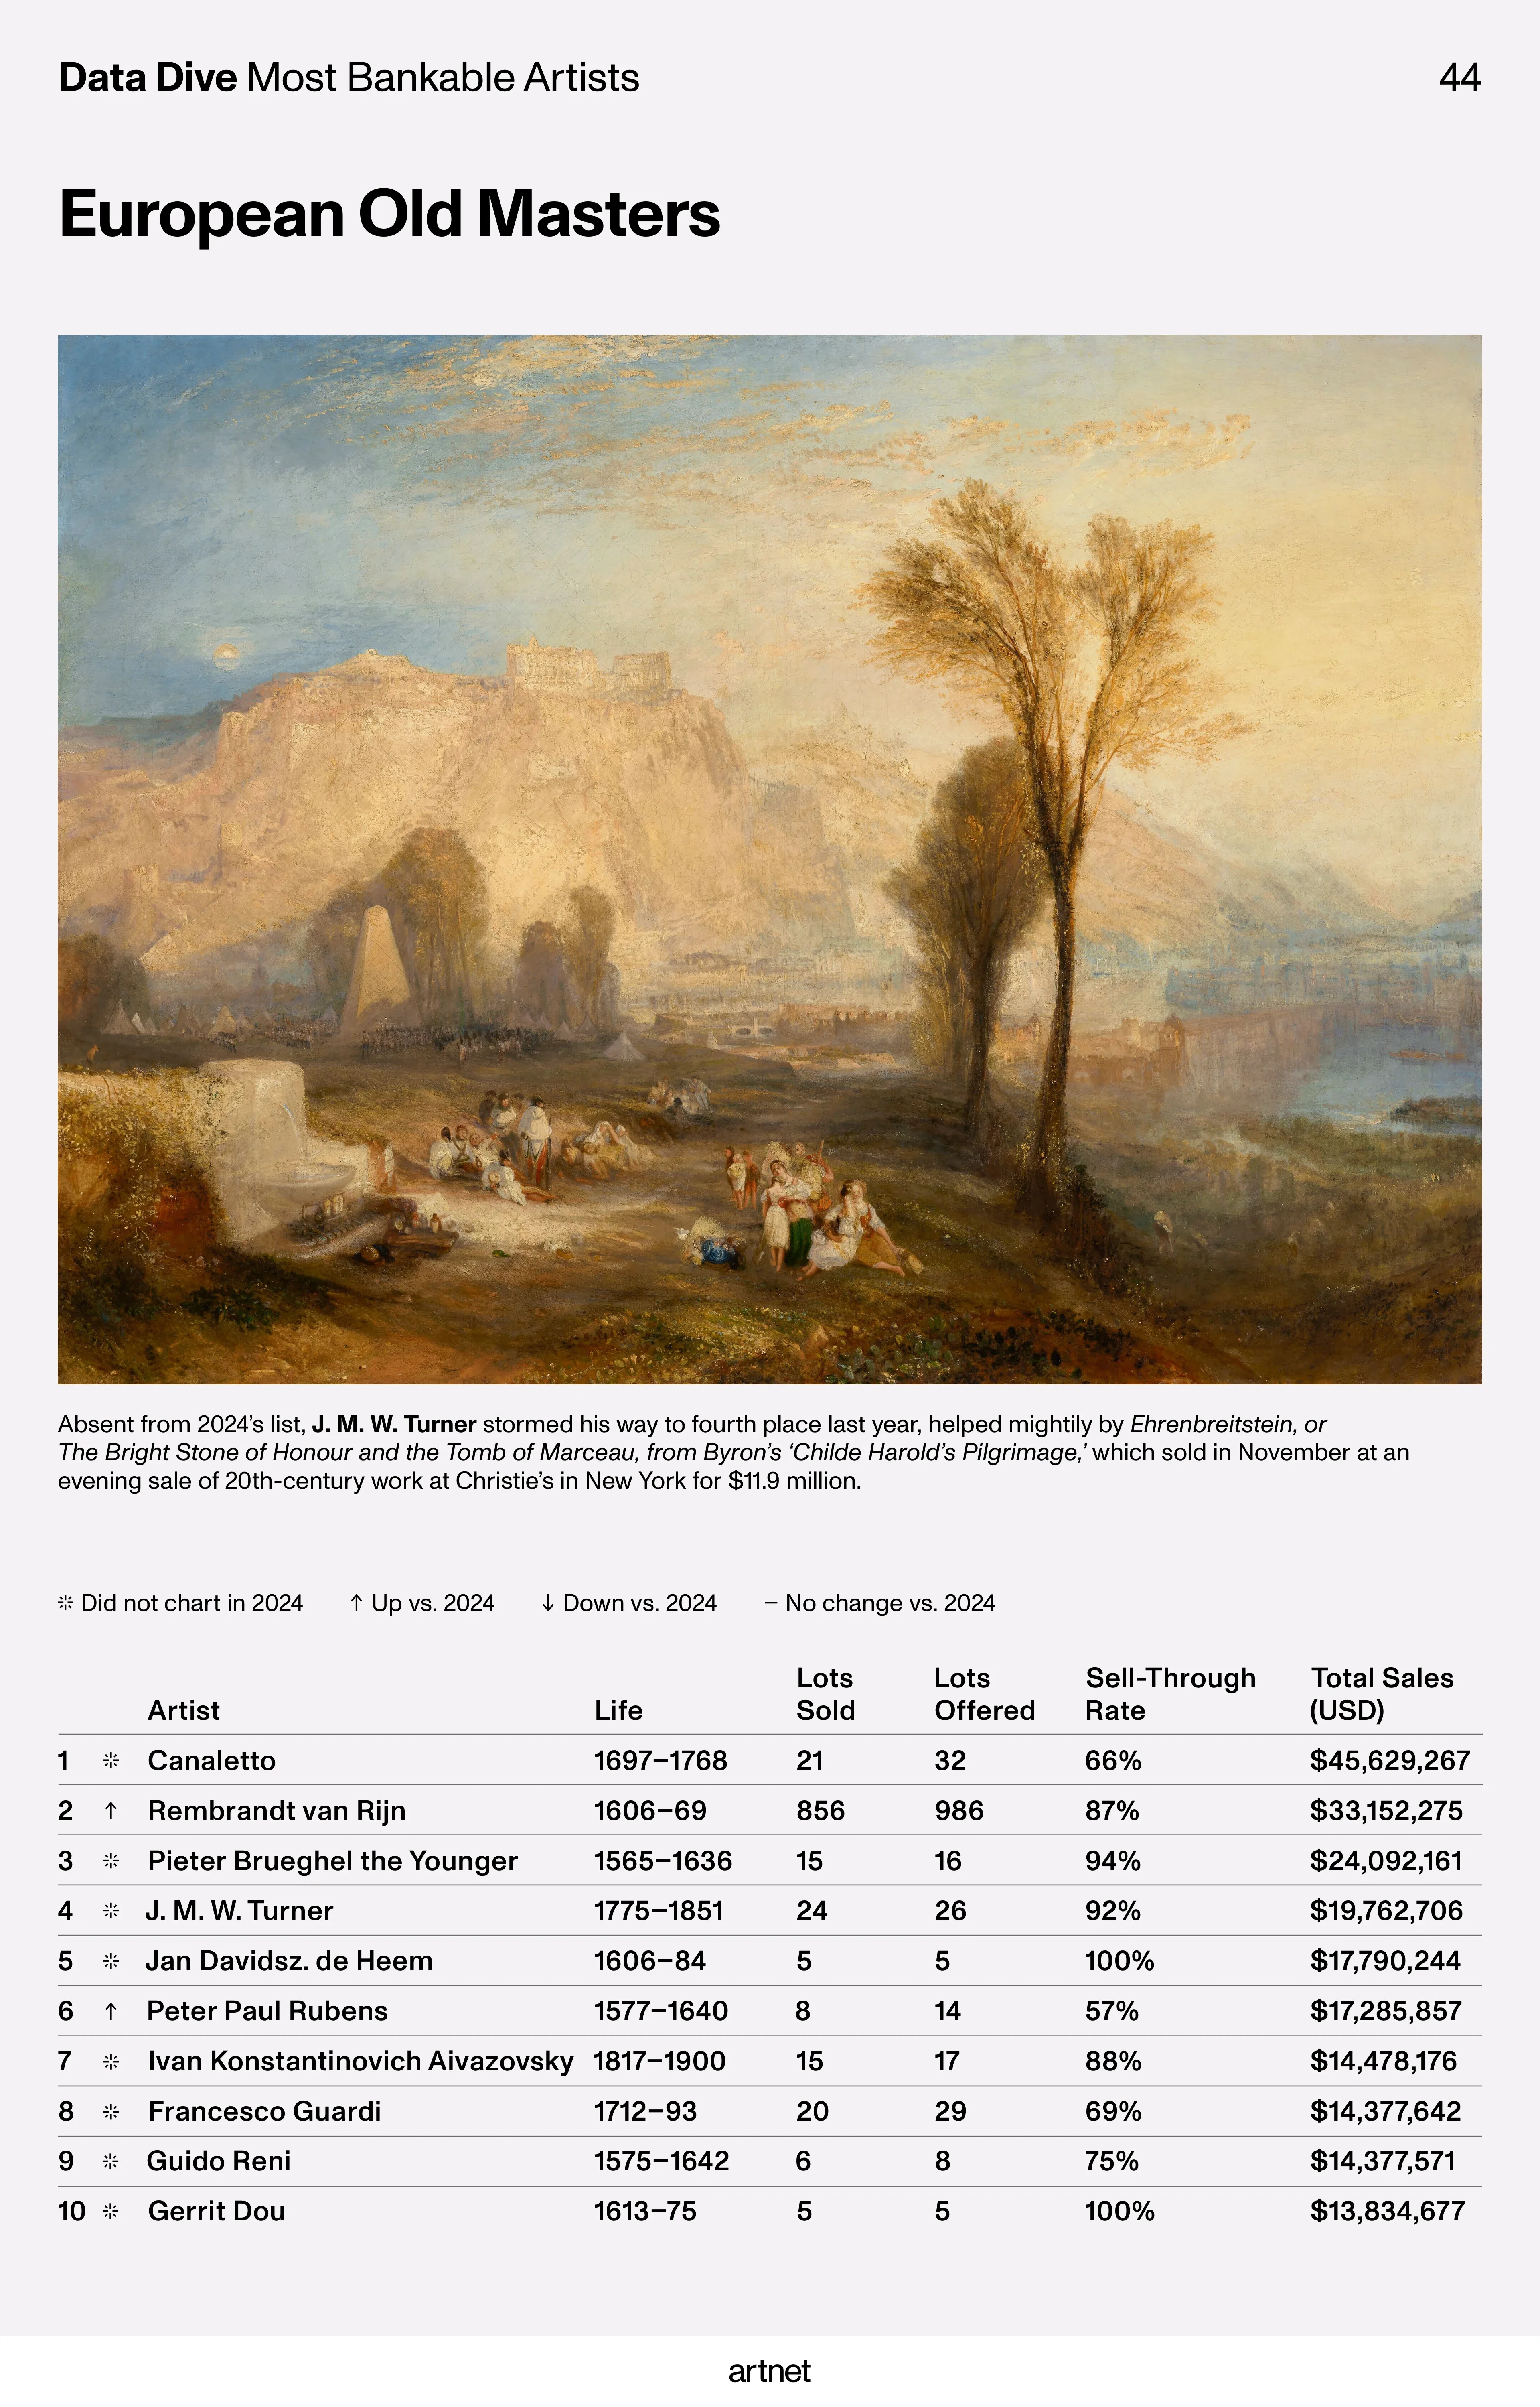
Search rankings measure database-user attention; sales rankings measure observed turnover. Neither is a ranking of artistic quality. Only ten women appeared among the top hundred artists by sales, and none among the top twenty.
Private auctions blend competition and discretion
The cover story compares invitation-only auctions, Sotheby’s Sealed, specialist ventures and Fair Warning. These formats combine deadlines and competition with limited exposure.
Bid visibility, participation and disclosure differ. Some reported private prices remain unconfirmed. Reduced public evidence complicates market measurement even where the transaction mechanism remains competitive.
Source report pages · 15–25Three interviews, three business perspectives
David Schrader emphasises deal flow and disciplined margins; Patti Wong discusses estimates, guarantees, premiums and the time needed to build Gulf collecting; Joe Maddalena describes Heritage’s popular-culture markets.
These are informed participants with business interests. Collectibles growth does not prove conversion into fine art, and flexible private terms do not automatically increase transparency.
Source report pages · 27–35Decorative art and the shifting boundary of collecting
Decorative-art sales were about $3.9 billion, with fewer lots and higher average prices. Design, furniture, jewellery and watches have different demand structures from fine art.
Bestseller lists and the Heritage interview show the role of popular culture and personal memory. Specify whether a claim concerns all collecting or a defined art market before aggregating totals.
Source report pages · 9–14、33–35、43Art Value Lab: test the recovery claim
Track turnover, lots, distributions, geography, guarantees and channels separately. Growth concentrated at the top should be described as such, and private transactions require acknowledging observational limits.
Then ask whether primary sales, galleries, workers and public institutions benefit. Auction growth answers only part of the question of value distribution. Use this report as a data map for the connected readings.
Source report pages · 37–50Methodology & source
Based on the supplied 52-page PDF, using printed page numbers. Page 50 covers 899 auction houses in calendar 2025 and lots with low estimates of at least $500. Prices include buyer premiums, use sale-day exchange rates and are not inflation-adjusted across years. Geography follows auction-house locations; China includes mainland China and Hong Kong. Private sales are excluded. Most genre analyses exclude Chinese artists, with dual-nationality exceptions and a separate ultra-contemporary rule. Categories use birth years: Old Masters 1250–1820; Impressionist/Modern 1821–1910; postwar 1911–44; contemporary 1945–74; ultra-contemporary after 1974. Page 41 gives an internally inconsistent $1.5 million total for a $10-million-plus segment; pages 6 and 43 differ on decorative-art growth. These inconsistent exact figures are not adopted. Interviews and unconfirmed private prices are distinguished from reported auction data.
The Intelligence Report: The Year Ahead 2026
Artnet Intelligence Report · March 2026