Beyond $1 million: what supports the rebound?
Supply, price bands and bidders behind the headlines
The upper end regained momentum in 2025. Beneath record prices, this study identifies the importance of the $1–10 million band, canonical works and new bidders.
Original research · Sotheby’s Financial Services × ArtTactic · Spring 2026
Reading & commentary · Art Value Lab
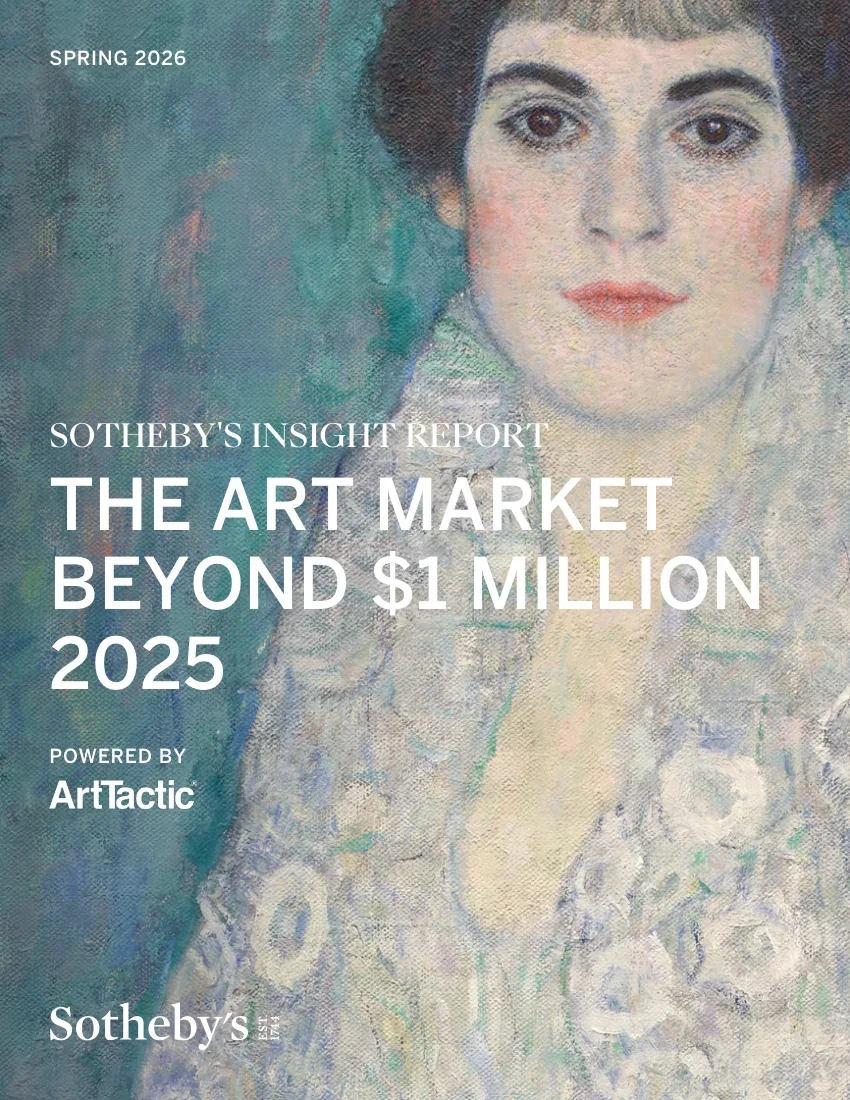 The Art Market Beyond $1 Million 2025
- Sales above $1 million grew 19.9% but remained below the historical average.
- The $1–10 million band contributed roughly 55% of high-end value.
- Auction data covers three houses; bidder data covers Sotheby’s only.
Figures refer to the source samples and survey period; expectations are not realised outcomes.
How much strength remains after the most expensive works are set aside?
A rebound short of a full recovery
Sales reached $4.31 billion, up 19.9%; lots sold rose from 813 to 914 and sell-through reached 94%. Both value and volume improved.
Totals remained below the period average. Higher sell-through can reflect more realistic pricing and tighter selection as well as demand.
Take with youDistinguish a rebound, stabilisation and full recovery.
Source report pages · 8–15A small number of lots dominates value
Works above $1 million accounted for 6% of lots but 76% of value in the broader sample. This is not representative of everyday collecting or primary-market activity.
At this concentration, the availability of a handful of works can move annual totals. Coordination among owners, estates and auction houses matters alongside demand.
The denominators differ: total lots and total value respectively. Source: p. 14.
The structural role of the $1–10 million band
The $1–10 million band contributed about 55% of high-end value, providing broader transaction depth than the trophy tier.
The above-$50 million segment grew sharply but contained just four sold lots. Its growth is highly sensitive to individual consignments, and ‘depth’ remains relative to this expensive market.
Source report pages · 15–17Scholarship and provenance shape competition
Impressionist and Modern art contributed around 58% of high-end value. Rarity, provenance and scholarship help explain demand across regions.
Women artists’ high-end results also depend on scarce, significant works. Landmark prices can accompany reassessment without establishing equality across the wider ecosystem.
Source report pages · 16–23、26–39Younger bidders can turn toward historical art
Sotheby’s bidders above $1 million increased 15%, while new bidders across three principal categories rose 85%. New to the house or dataset does not necessarily mean new to art.
Millennial and Gen Z participation in Impressionist and Modern bidding reached 17%. Age does not dictate a preference for newly made art, and regional differences remain.
Take with youLet participation data challenge assumptions about younger tastes.
Source report pages · 24–25Finance shapes the timing of supply
The lending interview describes how owners or estates can obtain funds before selling, potentially allowing staged disposals. Financial timing helps explain when works become available.
This is also a provider’s account of its services. It explains mechanisms without proving that borrowing suits every collector or improves every sale result.
Source report pages · 10–11、44–47The following editorial analysis explores mechanisms, practical approaches and open questions. It extends the source research without presenting new findings on behalf of its authors.
Liquidity depends on finding the next buyer
A past high price does not establish present liquidity. Buyer depth, intelligible pricing, sale timing and an owner’s ability to wait all matter.
The $1–10 million band provides relatively broader transaction activity than the trophy tier. That does not guarantee equal liquidity across artists or works within it.
Demand must meet available supply. Long-held works may remain unavailable despite interest, while a sudden cluster of similar works can change buyer choices. Turnover measures their meeting rather than demand alone.
Analysis references · source pages · 12–25Rarity, the canon and provenance provide different kinds of confidence
Rarity concerns availability, canonical status concerns recognised importance, and provenance concerns an object’s history. None alone guarantees demand or a successful sale.
An artist’s record cannot be transferred to every work. Period, medium, scale, condition and exhibition history affect whether a comparison is meaningful.
The report’s return to established categories can be read as attention to explicable quality amid uncertainty, rather than a proven psychological mechanism. The useful skill is articulating a work’s importance through evidence.
Analysis references · source pages · 16–23、26–39Different tiers imply different recovery mechanisms
| Tier / measure | Report observation | Interpretation |
|---|---|---|
| $1–10 million | About 55% of high-end value | Broader activity within a still highly exclusive segment |
| Above $50 million | Only four sold lots in 2025 | Individual works heavily influence growth |
| 94% sell-through | Better alignment in the offered sample | Read alongside selection, estimates and prior arrangements |
See pp. 12–17. Bands include buyer’s premium and do not describe primary-market activity.
How can you use this research?
Researchers and media
Pair records with lot counts and provenance context to show how exceptional the case is.
Collectors and curators
Compare significance and object characteristics before using sale records.
What changes when we read these together?
Methodology & source
The 2018–2025 dataset covers specified Christie’s, Sotheby’s and Phillips categories, with a $1 million threshold including buyer’s premium and sale-date currency conversion. Selected Les Lalannes design sales are included. Bidder data is Sotheby’s-only. Published by a financial-services business, the report includes a lender interview; this reading distinguishes evidence from service-provider perspectives.
The Art Market Beyond $1 Million 2025
Sotheby’s Financial Services × ArtTactic · Spring 2026