How the art market under $50,000 works
From a first purchase to the relationships sustaining everyday art activity
Beyond headline auction prices: how collectors begin, how galleries operate, and why encounters in person still matter.
Original research · Affordable Art Fair × ArtTactic
Reading & commentary · Art Value Lab
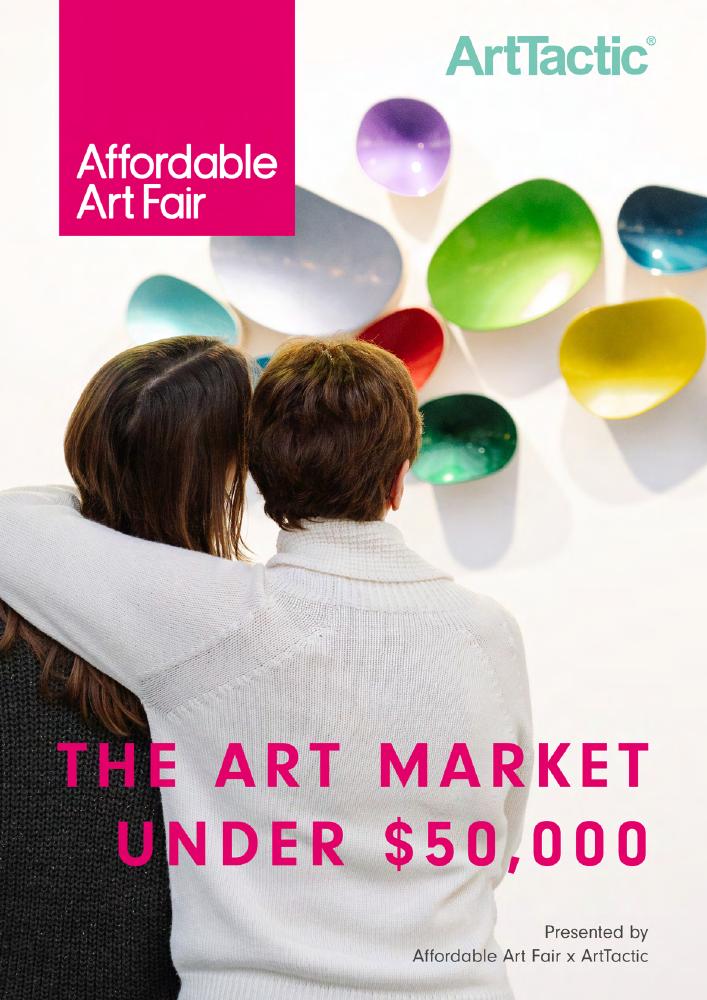 The Art Market Under $50,000 · 2026
- The $50,000 ceiling is much higher than the budgets most respondents commonly use.
- Attraction, artist support and trust combine along a collecting journey.
- Collector, gallery, auction and outlook datasets have different denominators and must be read separately.
Figures refer to the source samples and survey period; expectations are not realised outcomes.
Ask while reading: where does my audience discover art, and where would a conversation in person help?
Which market does the report describe?
The report focuses on works priced below $50,000 each. This broad ceiling is not a suggested starting budget, and different price bands need not operate in the same way.
It combines surveys of 3,302 buyers and collectors and 239 galleries, historical auction results at three houses, and an outlook from 72 experts. These describe participant experience, business operations, secondary-market transactions and expectations.
More respondents buying art does not necessarily mean rising total sales value. Optimistic galleries have not necessarily realised growth. Reading the datasets together is useful only if their boundaries remain visible.
Take with youScope determines how far a conclusion can travel.
Source report pages · 5, 78–80Collecting begins with a response to the work
Aesthetic value motivates 92% of respondents, supporting artists 49%, and investment value 19%. These motivations can coexist.
Supporting artists is cited by 57% of the report’s Millennial group, 55% of Gen Z and 37% of Boomers. Context about a continuing practice can therefore complement information about materials and form.
Willingness to support artists does not guarantee a purchase or a particular benefit. Proceeds depend on channels, agreements and costs.
Report pages 21–22. These are overlapping motivations, not investment returns or exclusive categories.
Actual budgets sit well below the ceiling
82% of respondents spend below $5,000 per work, including 62% below $2,500. These are nested groups and must not be added.
78% buy between one and five works a year. Participation can build gradually; purchase frequency and price per work remain different measures.
Galleries identify $1,000–$5,000 as an important sales range. Offering different price points still requires consistency with medium, scale, edition and the existing pricing context.
Take with youSeparate price per work, buying frequency and total expenditure.
Source report pages · 31–32, 48From discovery to understanding
Fairs are a discovery channel for 86% of collectors, galleries for 69%, social media for 36% and online platforms for 32%. One person may use several channels.
Physical encounters communicate scale, surface, colour and spatial relationships. Digital contact can precede or follow a visit, allowing further research rather than only immediate purchase.
Younger and newer buyers are less likely to discover through galleries. Their first encounter may happen elsewhere, even when they still need professional information.
Report page 24. Discovery channels, not purchasing channels or revenue shares.
A fair’s effects can continue after closing
54% of respondents purchased at their last fair; another 30% did not buy there but intended to follow up. Intentions are not completed sales, yet they identify an ongoing decision process.
Fairs account for an average 44% of surveyed gallery revenue. Galleries also seek visibility, new relationships and career development for artists. These related objectives need different measures.
Local, regional and international events can complement each other. Evaluating participation requires costs, follow-up work and time as well as revenue.
Take with youTransactions, understanding and relationships are related but distinct outcomes.
Source report pages · 24, 34, 43–45, 50–52Small galleries and sustained operations
64% of surveyed galleries have annual revenue below $250,000. 48% operate with one full-time worker and 37% with two or three. 56% have one permanent space and 26% no fixed space.
Over five years, 49% report improved sales and 33% stable sales. Lean operations may reduce fixed costs, but the survey does not establish that every small gallery is more profitable or faces lighter workloads.
Average revenue comes from fairs at 44%, gallery spaces at 35%, own websites at 14% and third-party platforms at 7%. These averages are not targets for every business.
Working with multiple artists may diversify exposure to styles, prices and career stages, while each relationship also requires resources and attention.
Report page 44. Revenue composition, not profit or growth.
Take with youBusiness size, revenue sources and profitability are separate questions.
Source report pages · 38–48What helps new buyers participate?
43% of galleries report more new buyers than five years earlier and 44% more younger buyers. Around 64% primarily serve collectors in the same country, retaining a strong local foundation.
Strategies include digital marketing and social media for 75%, lower-priced works for 53%, transparent pricing for 52% and working with emerging artists for 52%. They address different barriers.
Deeper community initiatives are less common. Beyond visibility, can a visitor ask questions, understand editions and condition, and feel able to return?
Take with youVisibility opens a door; information and conversation help people continue.
Source report pages · 54–59Cooling auctions can still exceed earlier activity
In the auction sample, 2025 sales value fell 21% and volume 19% year on year. Yet value remained 21% above the 2015–2021 average and volume 54% above it.
These statements use different baselines and can both be true. A market may retreat from a peak while remaining more active than in an earlier period.
Works below $5,000 represented 33% of lots sold in 2025; the $25,000–$50,000 band represented 44% of value. Volume and value show different forms of concentration.
Women artists’ average sales-value share was 25% in 2022–2025 versus 17% in 2015–2021. Prints and editions represented 23% of 2025 volume and 16% of value. These are bounded auction observations, not all-market statistics.
Take with youCheck the period and unit before naming a trend.
Source report pages · 62–63, 66–71Expectations, media and living conditions
69% of galleries anticipated sales growth in 2026, while 61% of experts had a positive outlook for this price tier. These were expectations when surveyed, not realised annual results or forecasts for an individual work.
Painting remains important, alongside prints, works on paper, sculpture and photography. Display space, preservation and moving also affect participation.
Source report pages · 7, 26, 31, 75–76Putting the research to work
First-time collectors can build looking experience by recording what attracts them and what remains unclear. Market expectations should not replace personal judgement.
Artists and galleries can review the whole journey: discovery, accessible information, conversation and material that remains available after an exhibition.
Platforms and educators can teach practical skills such as reading labels, understanding media and editions, and distinguishing sales contexts. These help curiosity become sustained participation.
Take with youTranslate research into clearer information, better questions and continuing exchange.
Source report pages · 75–80The following editorial analysis explores mechanisms, practical approaches and open questions. It extends the source research without presenting new findings on behalf of its authors.
Beyond price: what makes collecting accessible?
Most collectors in the sample budgeted below $5,000, but affordability does not automatically produce a purchase. Understanding a work, assessing its price and arranging transport or installation can all create uncertainty. Clear information is part of access.
Fairs were a major discovery channel in a sample connected to Affordable Art Fair. This cannot establish that fairs dominate every market. Purchases at the latest fair also need to be distinguished from intentions to buy later; follow-up may take weeks or months.
We suggest examining discovery, understanding, comparison, decision and aftercare separately. Work context, visible prices, care and delivery information serve different stages. Following how questions are resolved can explain trust more fully than an event-day conversion rate.
Analysis references · source pages · 21–25, 31–34, 48, 54–59Why gallery growth requires more than revenue
Many galleries surveyed operate with one to three people. The same team may manage artists, exhibitions, sales, shipping and administration. More sales can increase workload; whether growth improves the business depends on costs, payment timing and capacity.
Fairs generated an average 44% of revenue, but revenue share is not profit share. Booths, travel, insurance, transport and follow-up affect results. Two events with equal sales can create very different value. The report cannot supply a common return on investment for all galleries.
Our suggested management framework compares revenue, direct costs, hours and repeat purchases by channel. It connects audience growth with the capacity to support artists. This is editorial guidance, not a financial conclusion established by the survey.
Analysis references · source pages · 38–48, 54–59, 78–80Three figures, three different scopes
| Reported figure | Appropriate scope | Avoid inferring |
|---|---|---|
| 82% budget below $5,000 | Budgets of surveyed collectors | 82% of all market transactions fall below this price |
| Fairs average 44% of gallery revenue | Surveyed galleries’ channel mix | Fairs deliver the highest net profit |
| 2025 auction value −21%, volume −19% | Selected houses and defined works | Every entry-level channel declined equally |
Collectors, galleries and auctions use different samples and cannot be treated as one population. Comparison guidance is Art Value Lab analysis.
How can you use this research?
First-time collectors
Ask about transport, framing, care and documentation alongside price. Compare total ownership costs and living circumstances, allowing time to understand the work.
Galleries and fair teams
Track immediate purchases, follow-up intentions and completed repeat purchases separately, alongside buyer questions and service hours.
What changes when we read these together?
Methodology & source
Collector and gallery surveys ran from mid-November 2025 to early January 2026, with 3,302 respondents and 239 galleries. Galleries largely operate in the primary market for living artists. Auction analysis covers selected Christie’s, Sotheby’s and Phillips sales in 2015–2025 and living artists born from 1930; values use sale-date exchange rates. The outlook separately includes 72 experts. The report uses its own age bands, which should be checked before cross-study comparisons. Publisher context and recruitment can shape findings. Online purchasing figures differ between pages 8 and 28, and the heading and body of page 64 conflict; this guide does not chart or base core conclusions on those figures.
The Art Market Under $50,000 · 2026
Affordable Art Fair × ArtTactic